
Monitoring & Insights
Overview
What is Grafana ?Grafana is a powerful open-source tool for visualizing and monitoring time-series data. It is highly customizable, supports a wide range of data sources, provides real-time monitoring capabilities, and is easy to use.
Grafana plays a crucial role in both technical monitoring and business insights, providing essential information and visualizations. The Grafana dashboards for the Ratefox Client are tailored to complement a wide range of performance reports, catering to different audiences:
- 💼 Business.
- 💰 Monetary performance.
- ⚙️ Technical performance.
Key Dashboards
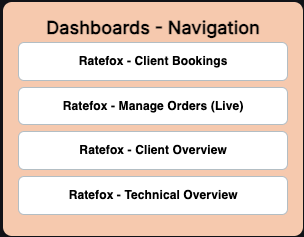
Home - Dashboards Navigation
A streamlined navigation dashboard providing quick access to all available dashboards.
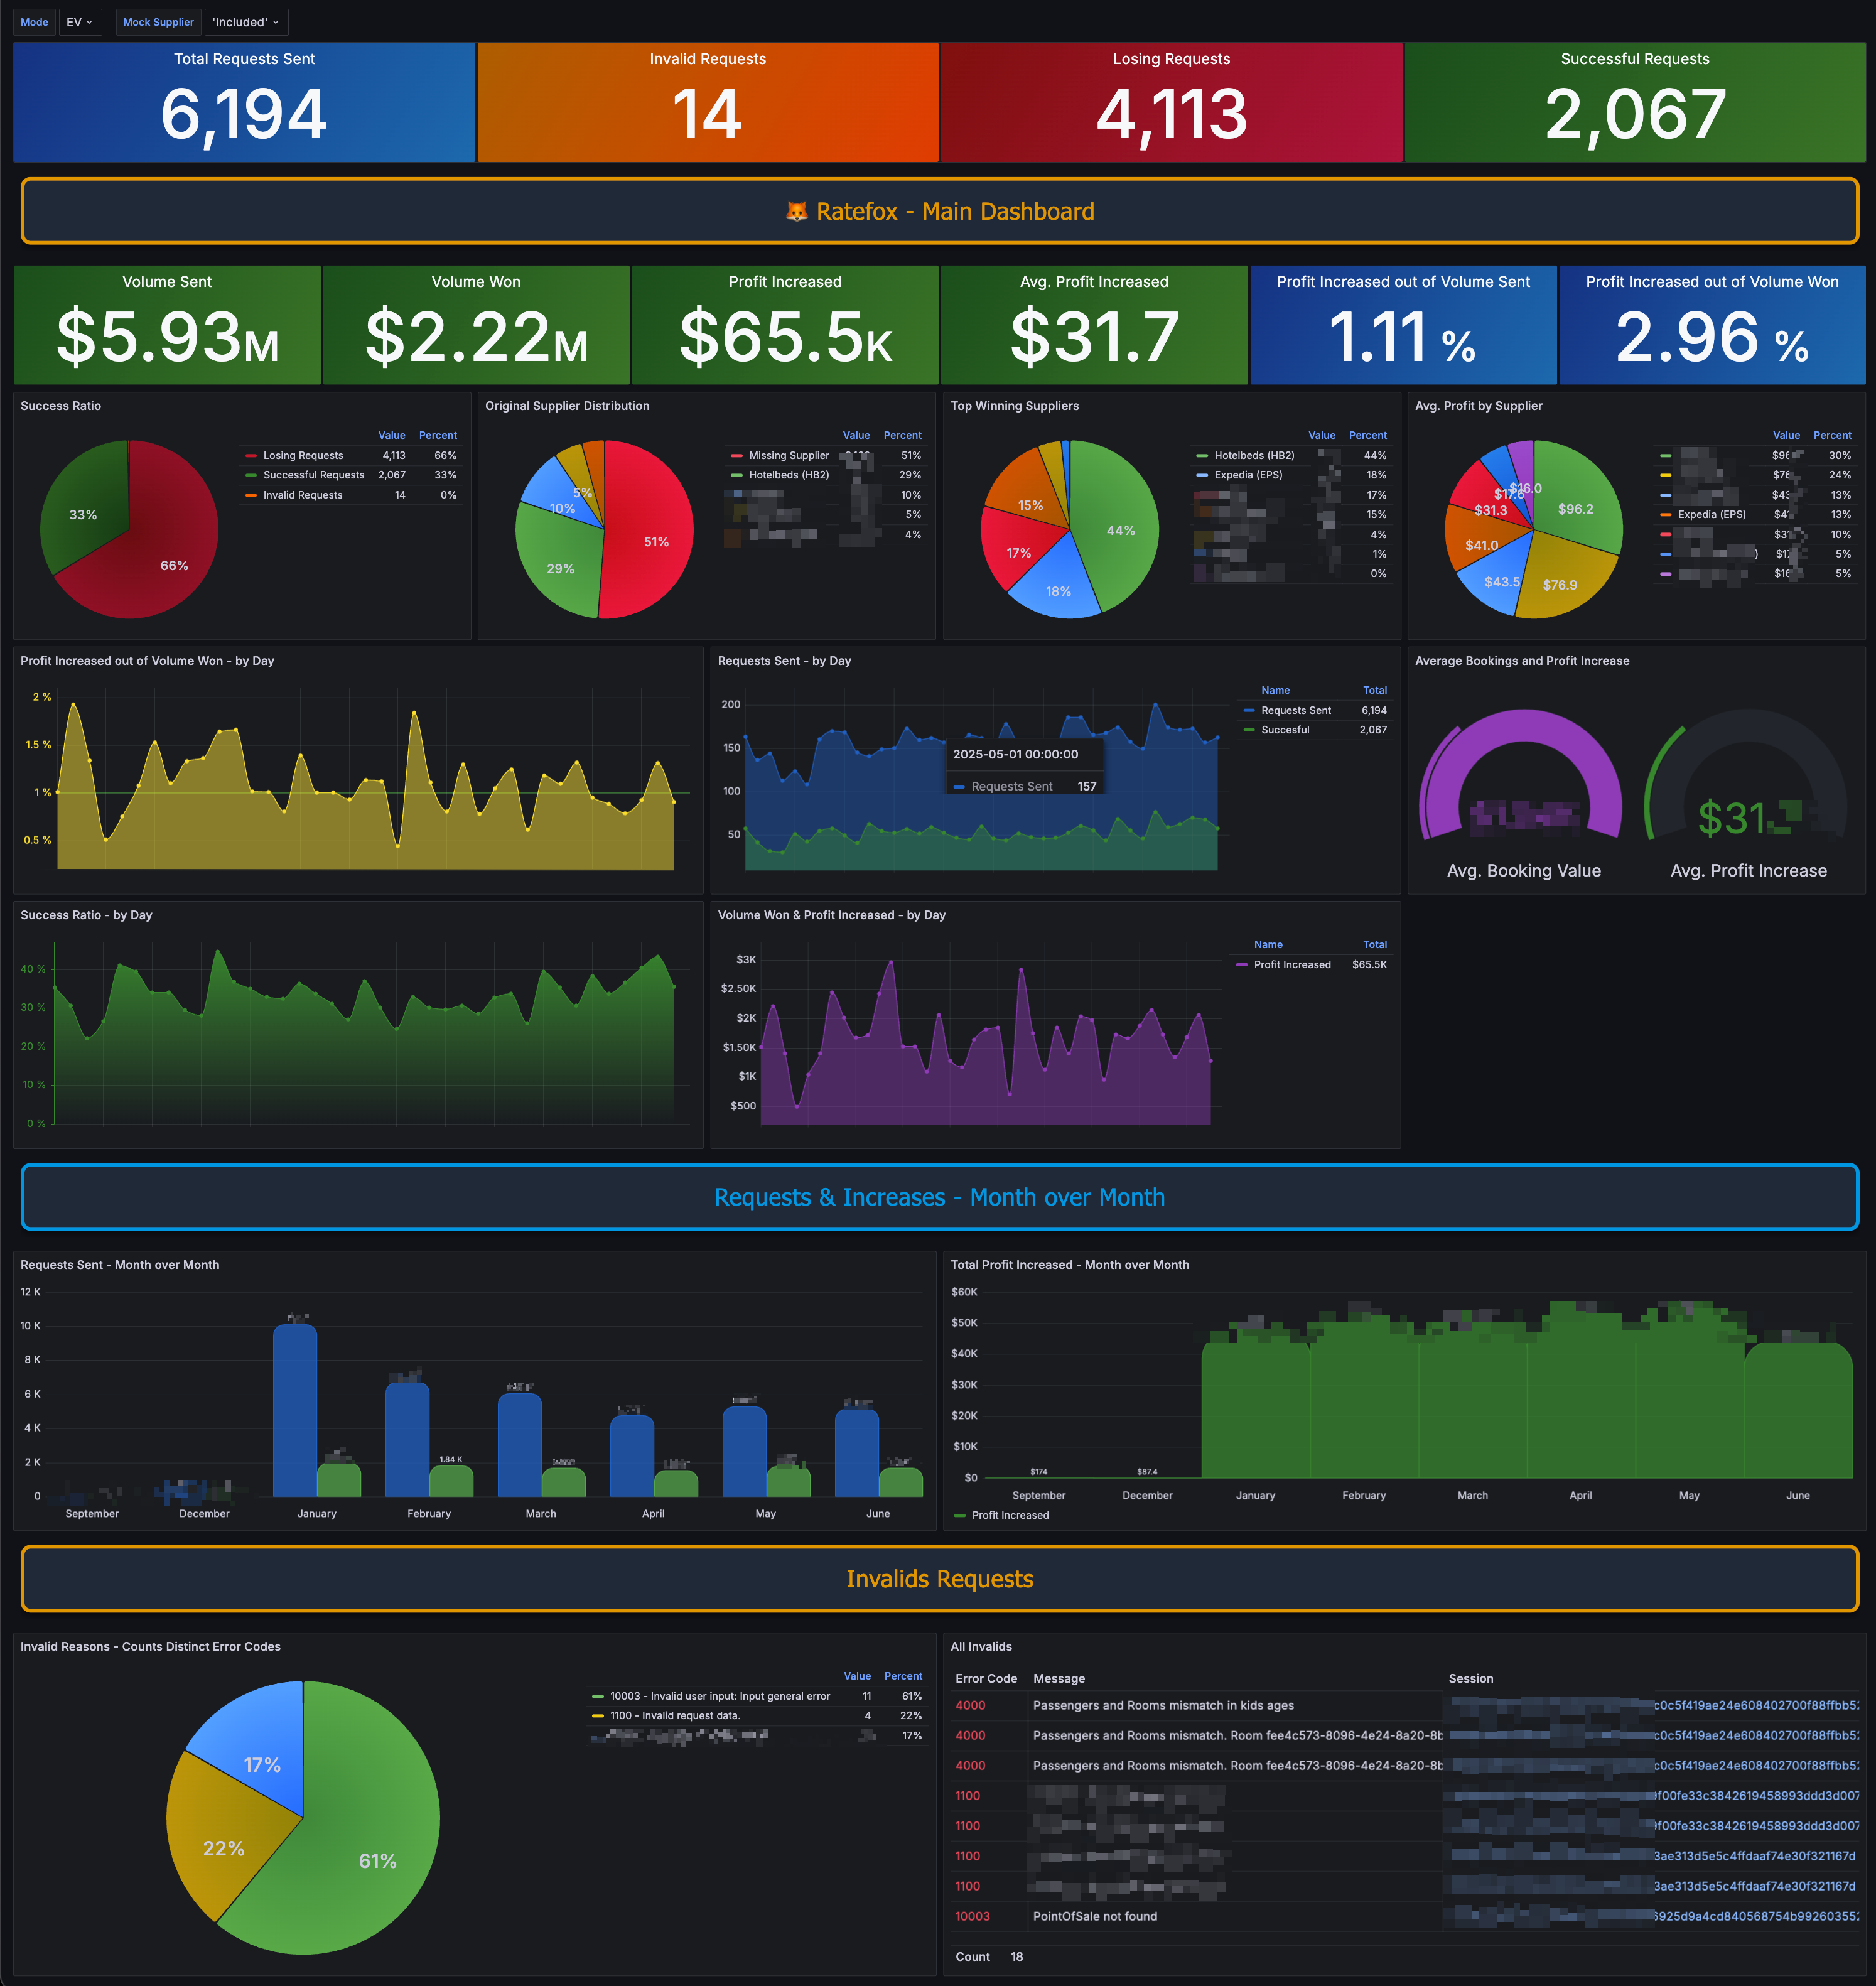
Ratefox - Main Dash
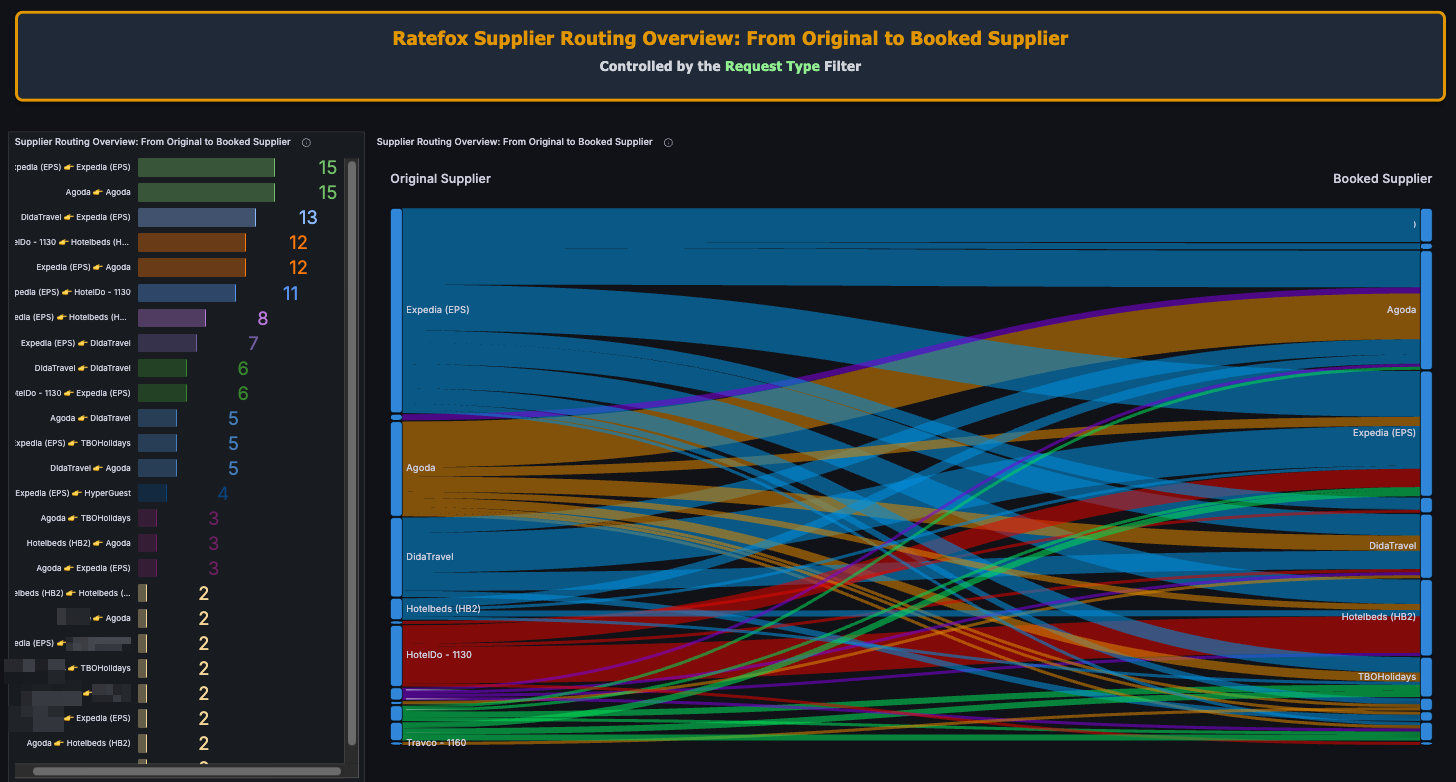
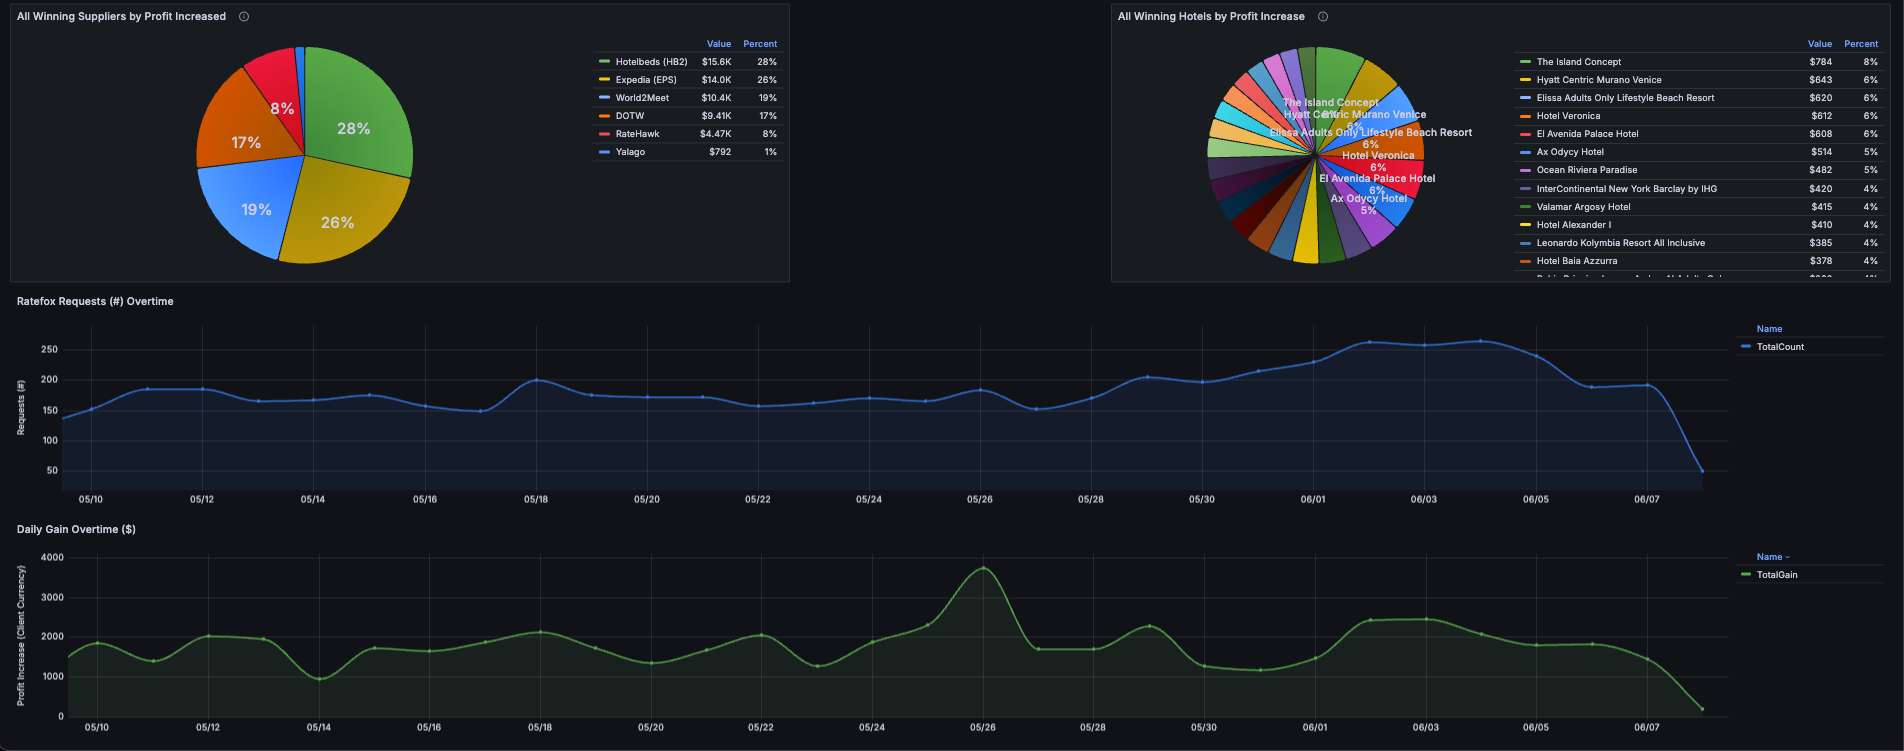
This dashboard showcases your key performance indicators (KPIs) and high-level Ratefox metrics, including request distribution, average profit increase , original and booked suppliers, and supplier-level profit trends. It also provides month-over-month comparisons and over-time graphs to highlight request volumes, wins, and profitability.
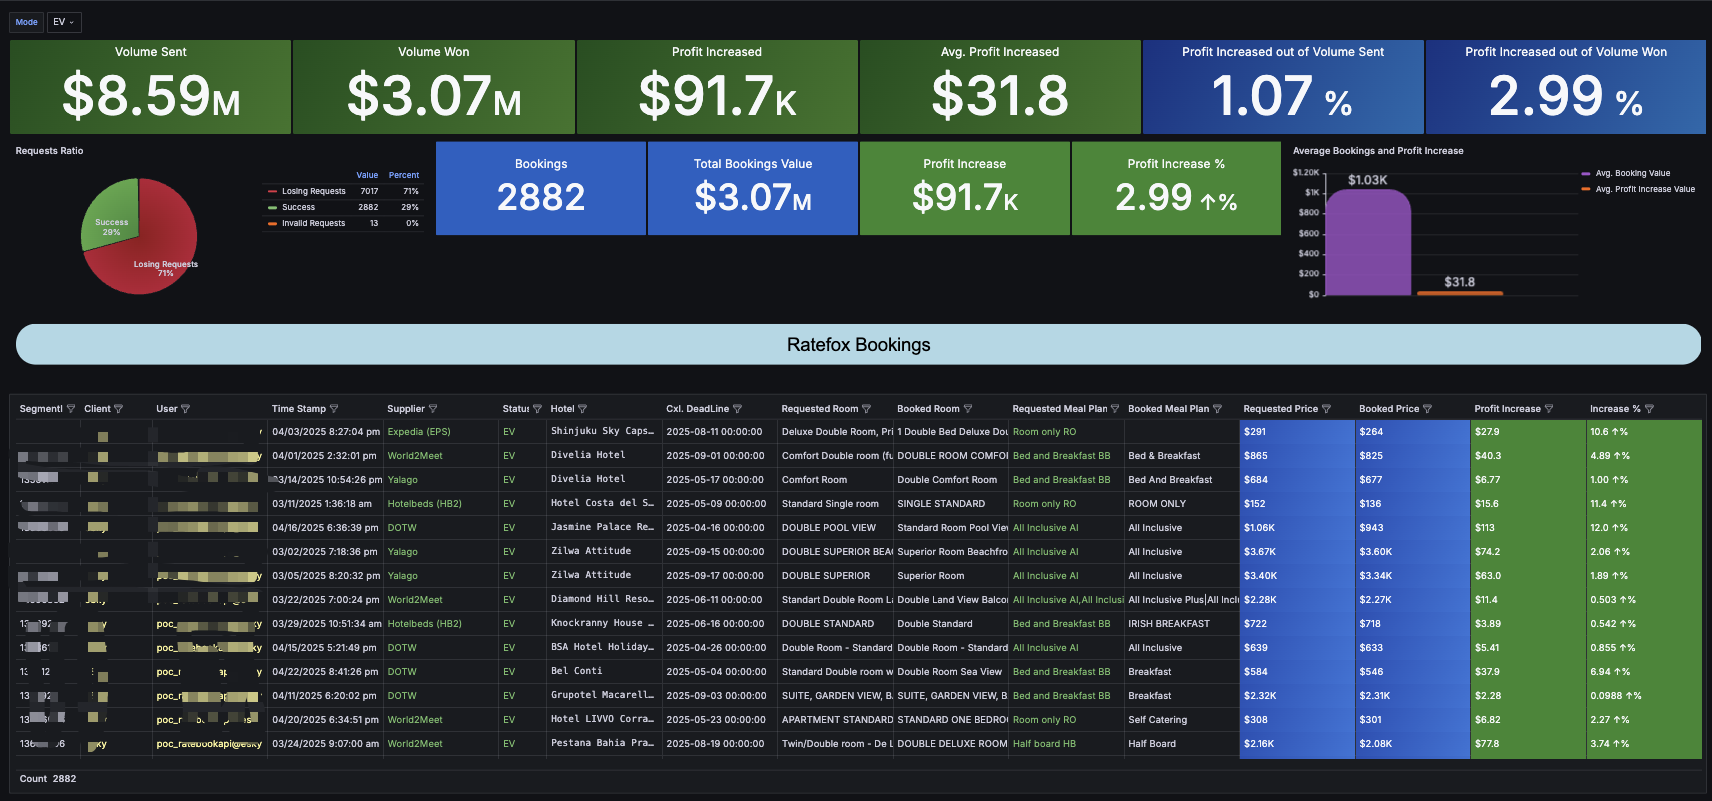
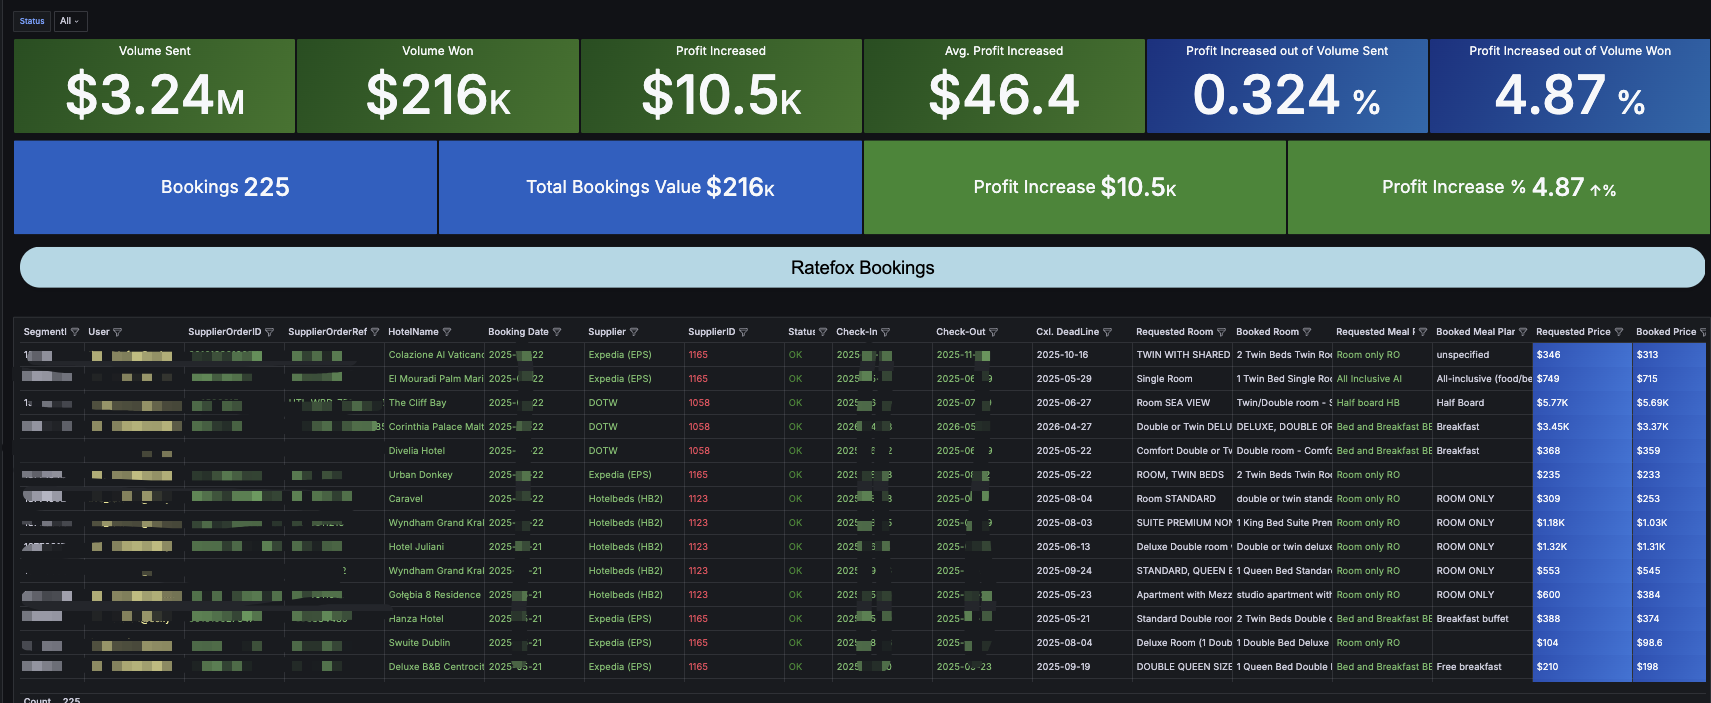
Ratefox - Client Bookings
This dashboard highlights your successful Ratefox bookings, showcasing key data such as the success ratio, booking numbers, monetary details, profit growth, and a table comparing the requested and booked prices for each booking.
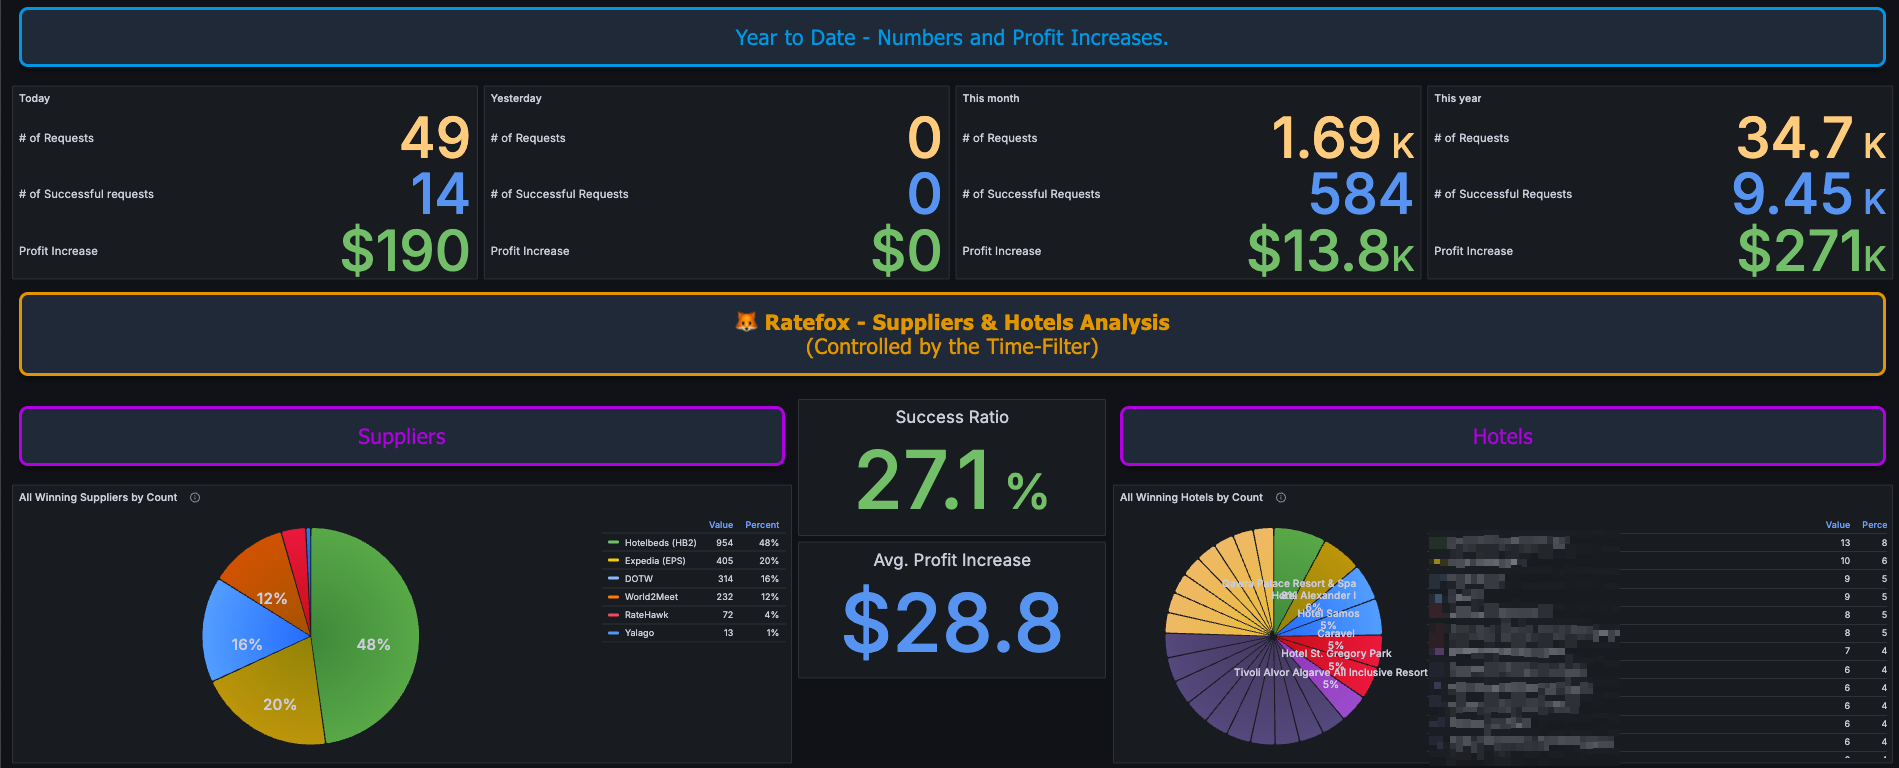
Ratefox - Client Overview
The Client Overview dashboard offers a complete snapshot of your Ratefox performance, including the number of requests, successful transactions, and profit growth across daily, monthly, and year-to-date periods.
🔄 Supplier Sent vs. Supplier Booked – Highlights the differences between the originally requested supplier and the final booked supplier, providing insights into supplier routing behavior.
Also breaks down request counts, booking volumes, and profit increases by supplier for deeper insight.
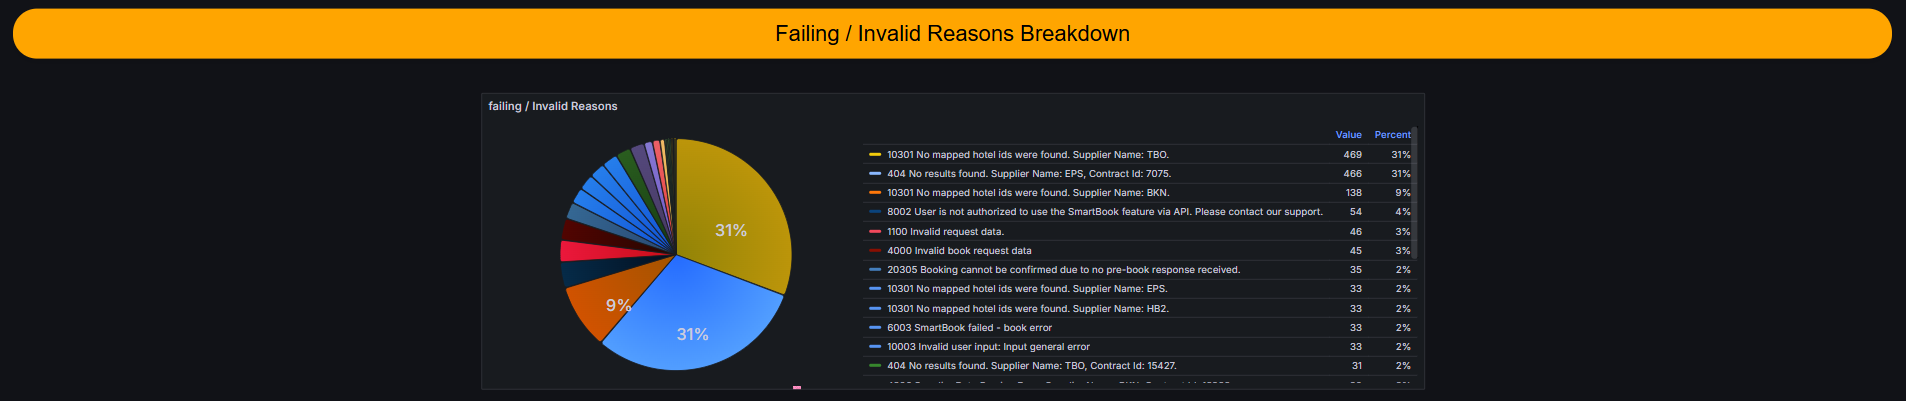
Ratefox - Technical Overview
The technical overview provides partners with a comprehensive view of Ratefox technical performance. It highlights the request success ratio, request and success trends over time, a month-over-month comparison for the past six months, and a breakdown of failed and invalid request distribution.
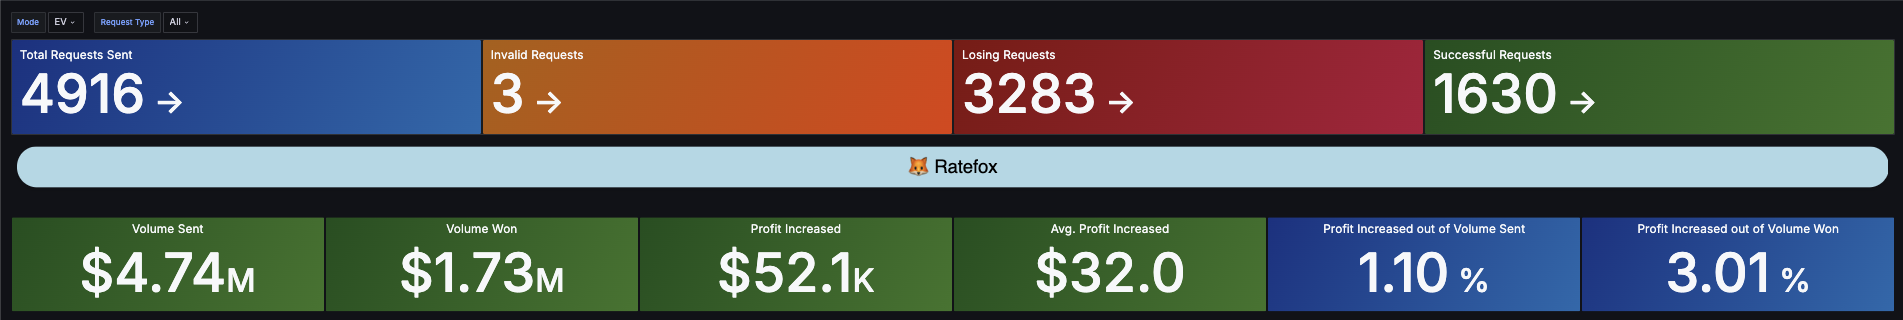
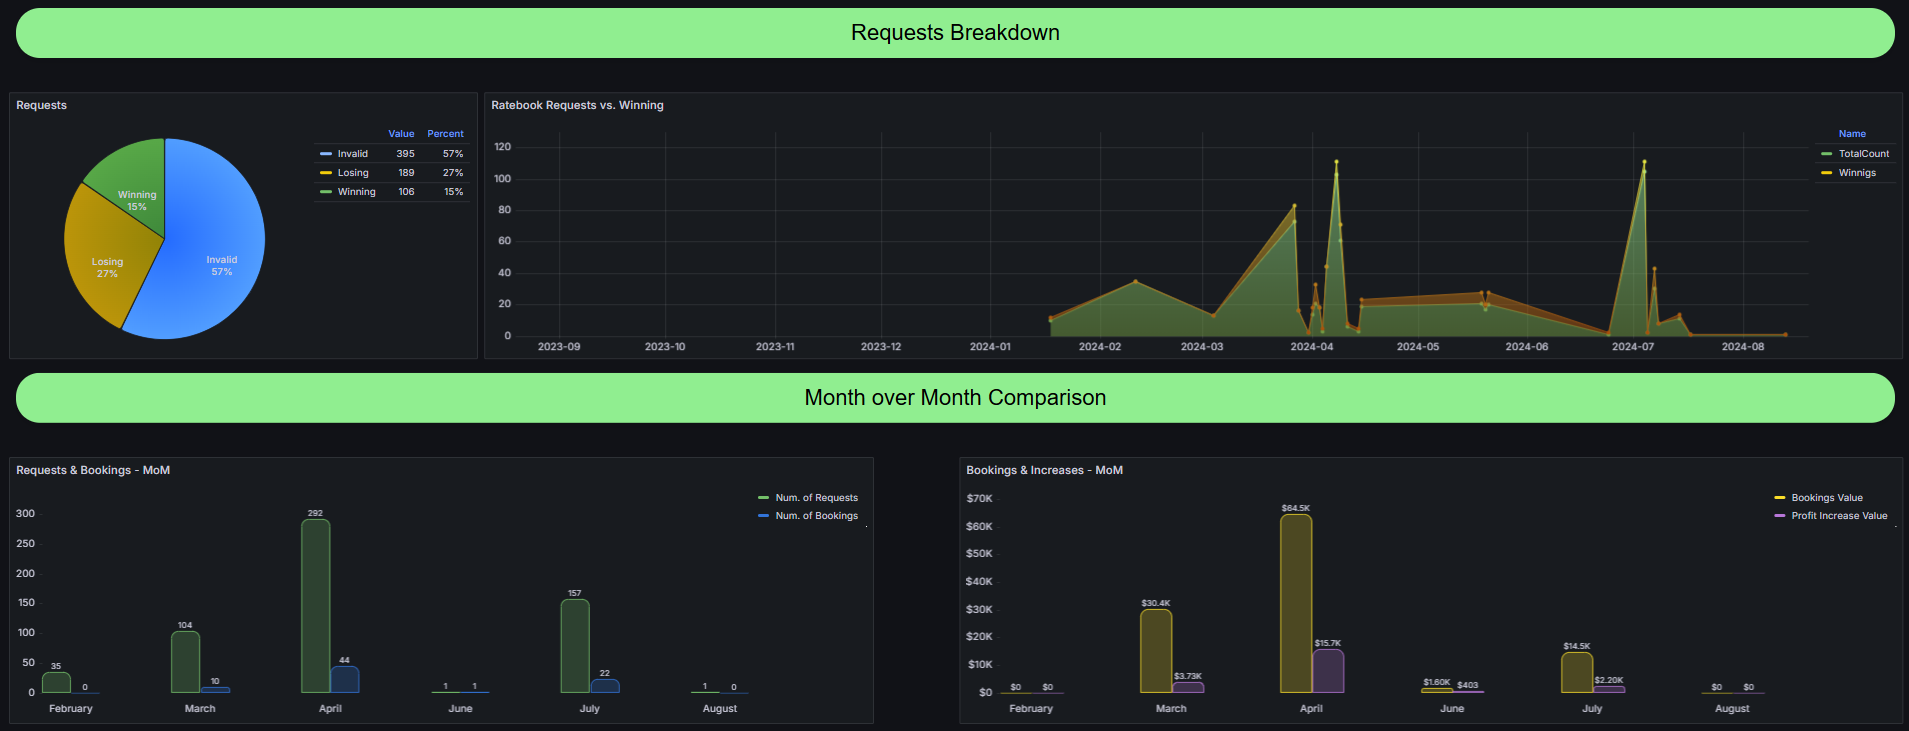
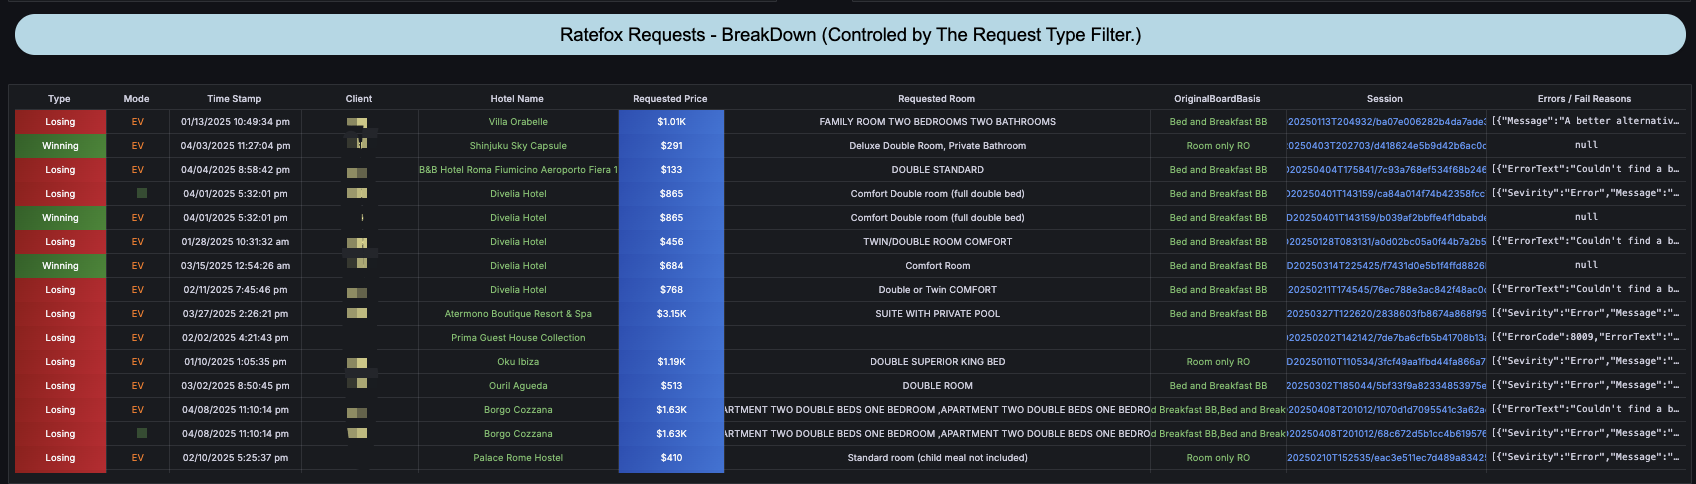
Note -The 'Ratefox - Requests Breakdown' section is controlled by the 'Request Type' filter, allowing you to easily assess your requests—whether they are Losing, Invalid, or Successful.
The Session ID can be later used and shared with the support team for further investigation and technical review.
Ratefox - Manage Orders (Live)
This dashboard highlights your successful Ratefox Live bookings, showcasing key data such as the success ratio, booking numbers, monetary details, profit growth for only Live Bookings in the system, with addition of Supplier Book id and reference.
Updated about 2 months ago