
Gimmonix Dashboards (Grafana) - Monitoring
Overview
Gimmonix built a monitoring, tracking and data visualization tool with dashboards, reports and real time data to track and monitor many aspects of the systems like performance and clients usage and business insights, many of the dashboards and reports are available to all Gimmonix' clients.
Tailored Client Dashboards
Gimmonix offers Customized dashboard for all our client.
How to get access ?To obtain access for your Dashboards, please submit a ticket to our support team, once the dashboard is ready - you will receive the credentials for your dashboard along with the associated end-point .
Our Customized dashboards offers a wide range of both technical and business insights in Real-Time.
This includes live information that will empower you to make informed decisions, monitor Searches, GetPackages, and track bookings per supplier/user, among much more information!
Each Client Dashboard includes:
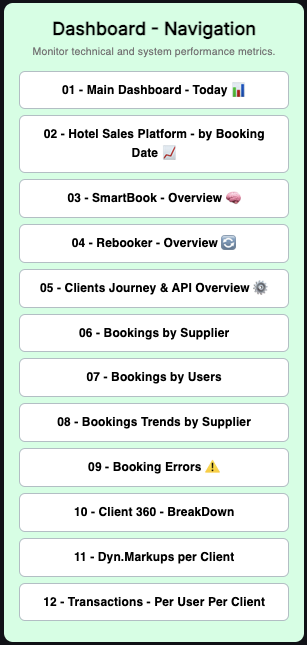
00 - Home - Dashboards Navigation
A streamlined navigation dashboard providing quick access to all available dashboards.
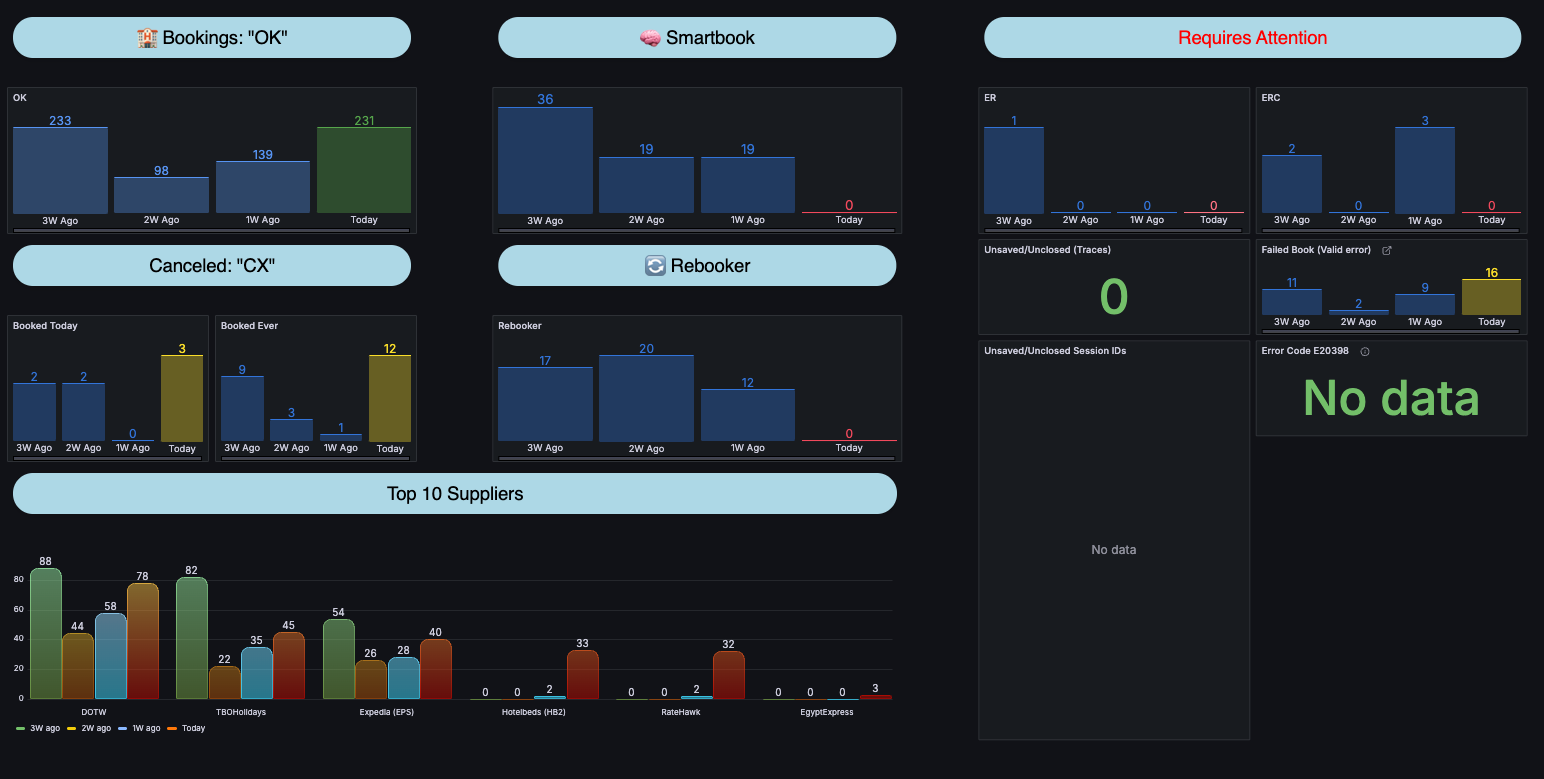
01 - Main Dashboard - Today 📊
Filtering Options : None.
A central monitoring hub showing daily real-time data, including the number of bookings, cancellations, status codes (ER/ERC), failed bookings, SmartBook and Rebooker stats (if applicable), among other metrics.
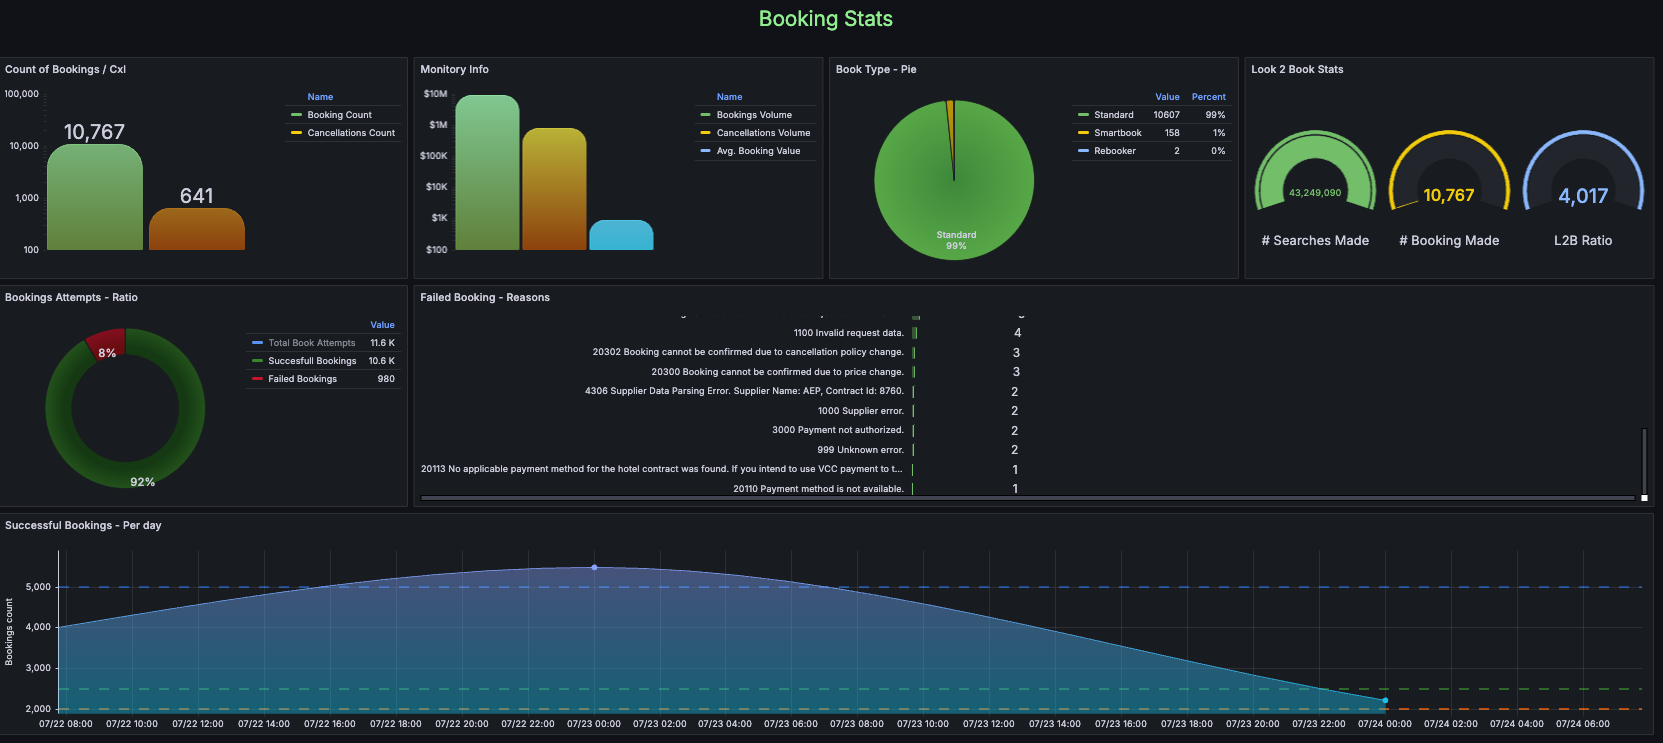
02 - Hotel Sales Platform - by Booking Date 📈
Filtering Options : Dates, Nodes and Users.
Displays all performance stats in one place !
-
Booking Stats: Displays bookings and cancellations over time, including L2B and other detailed breakdowns.
-
Cancellation Stats: Displays cancellations information and other detailed breakdowns.

-
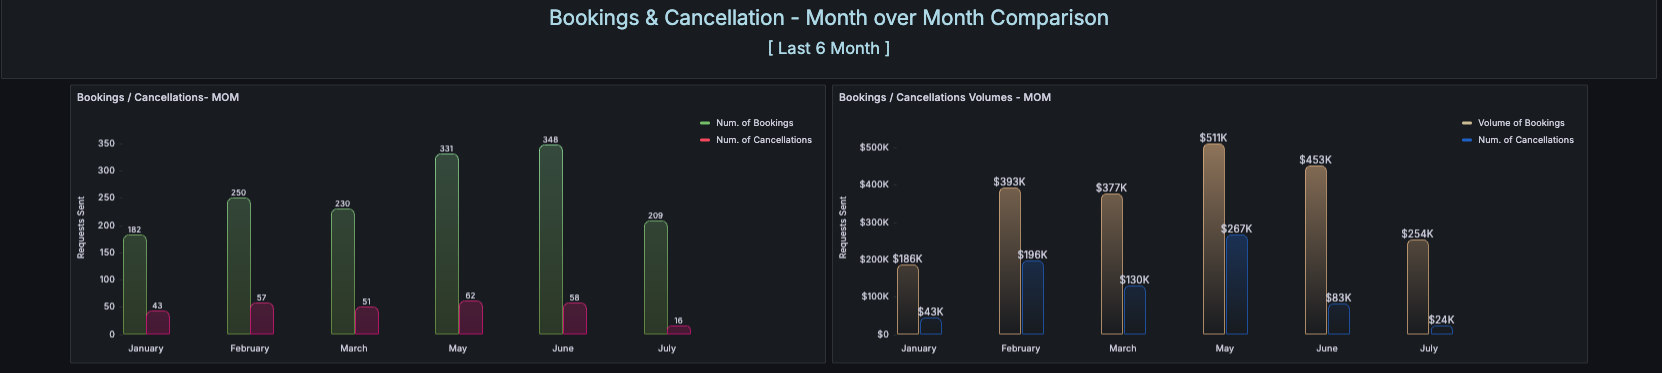
Bookings & Cancellation - Month over Month Comparison: Last 6 month Booking count and Volumes.
-
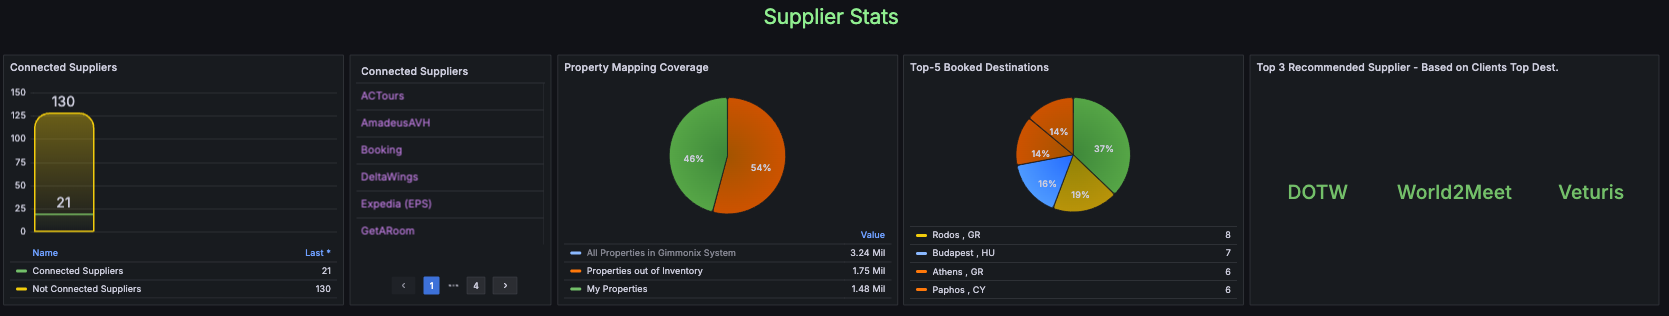
Supplier Stats: Your connected supplier, property mapping and Recommended suppliers breakdown.
-
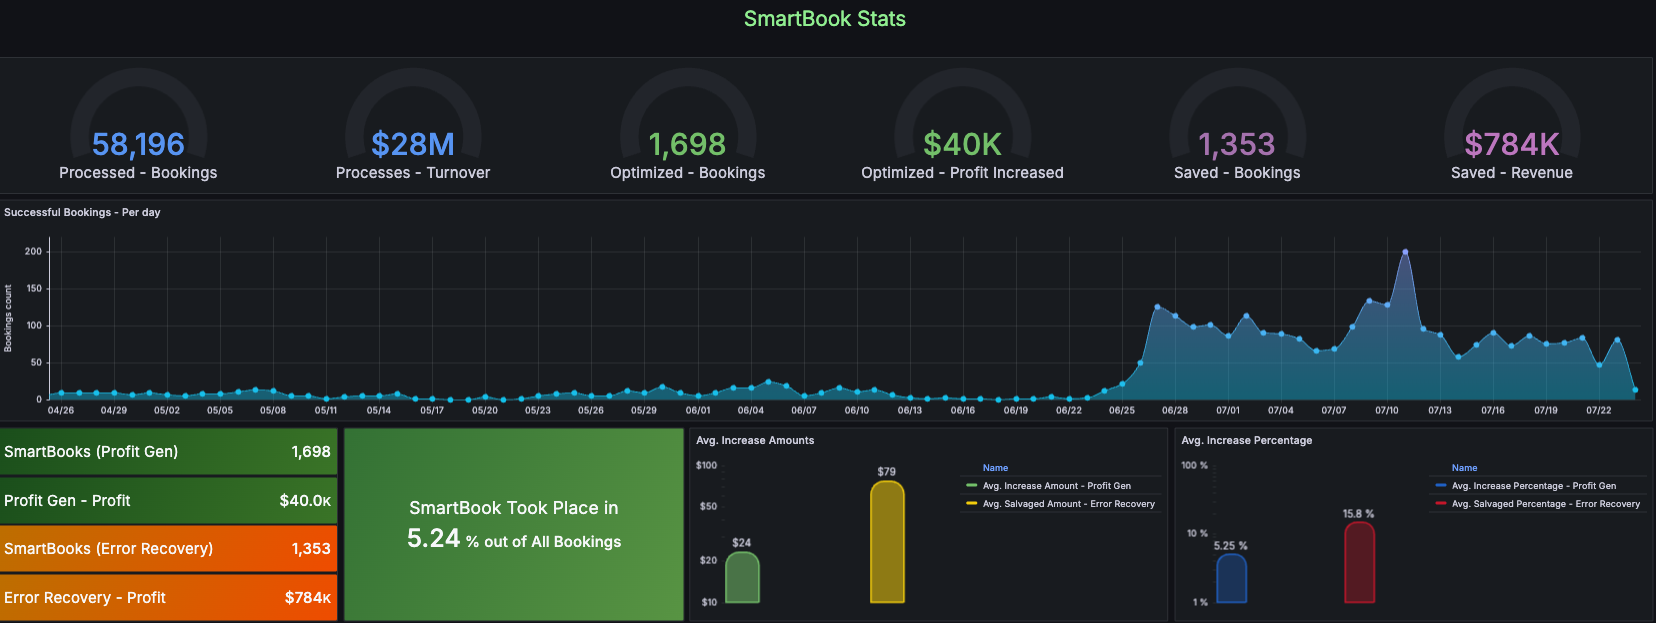
SmartBook Stats: Shows how SmartBook operates, including the volume of bookings it generates and the amount saved. This helps to understand its efficiency and impact.
-
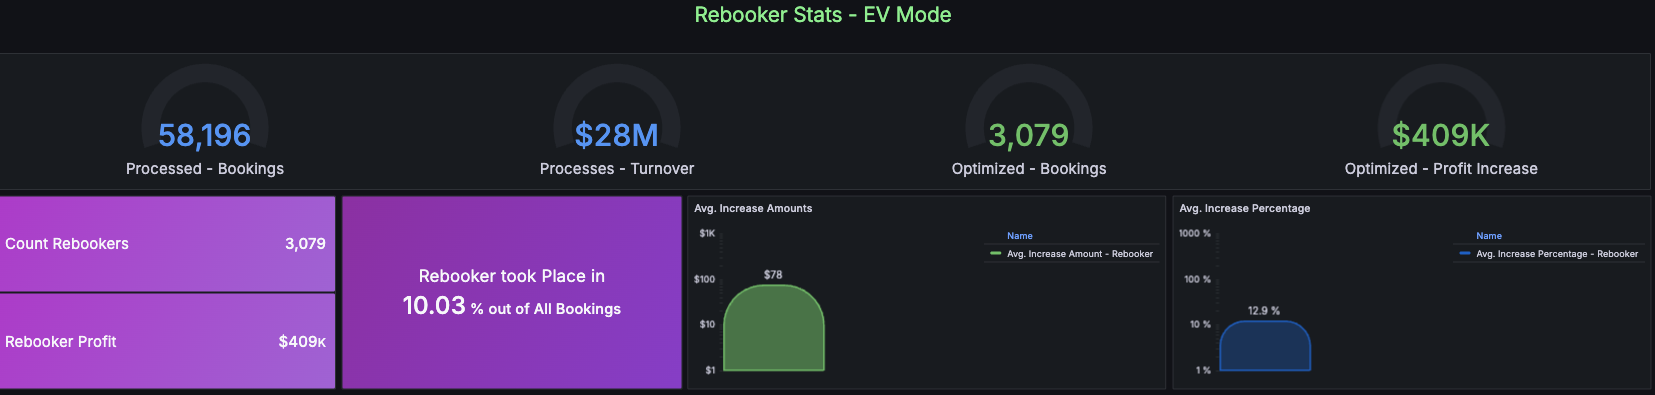
Rebooker Stats: Shows how Rebooker operates, including the volume of bookings it generates. This helps to understand its efficiency and impact.
-
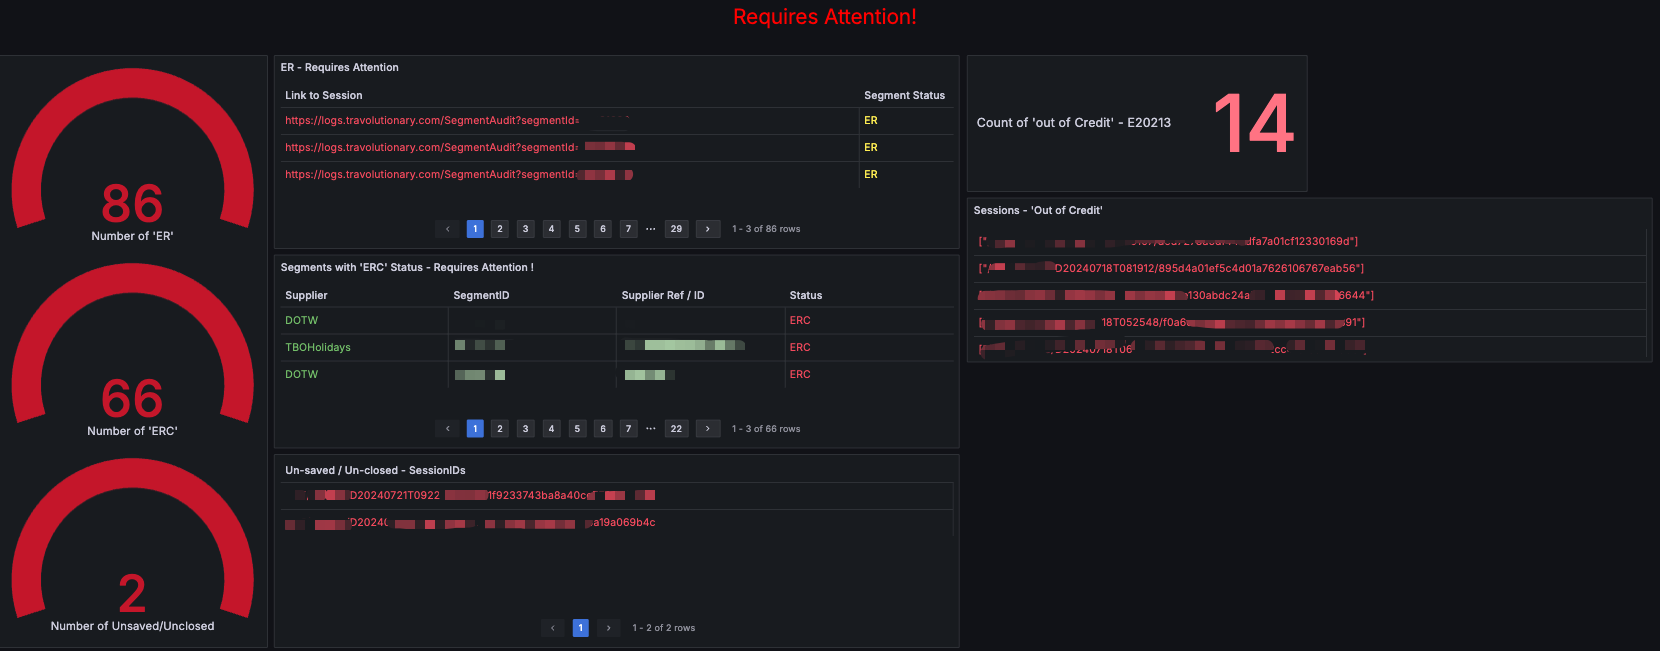
Requires Attention: ER/ERC and unsaved bookings requiring attention.
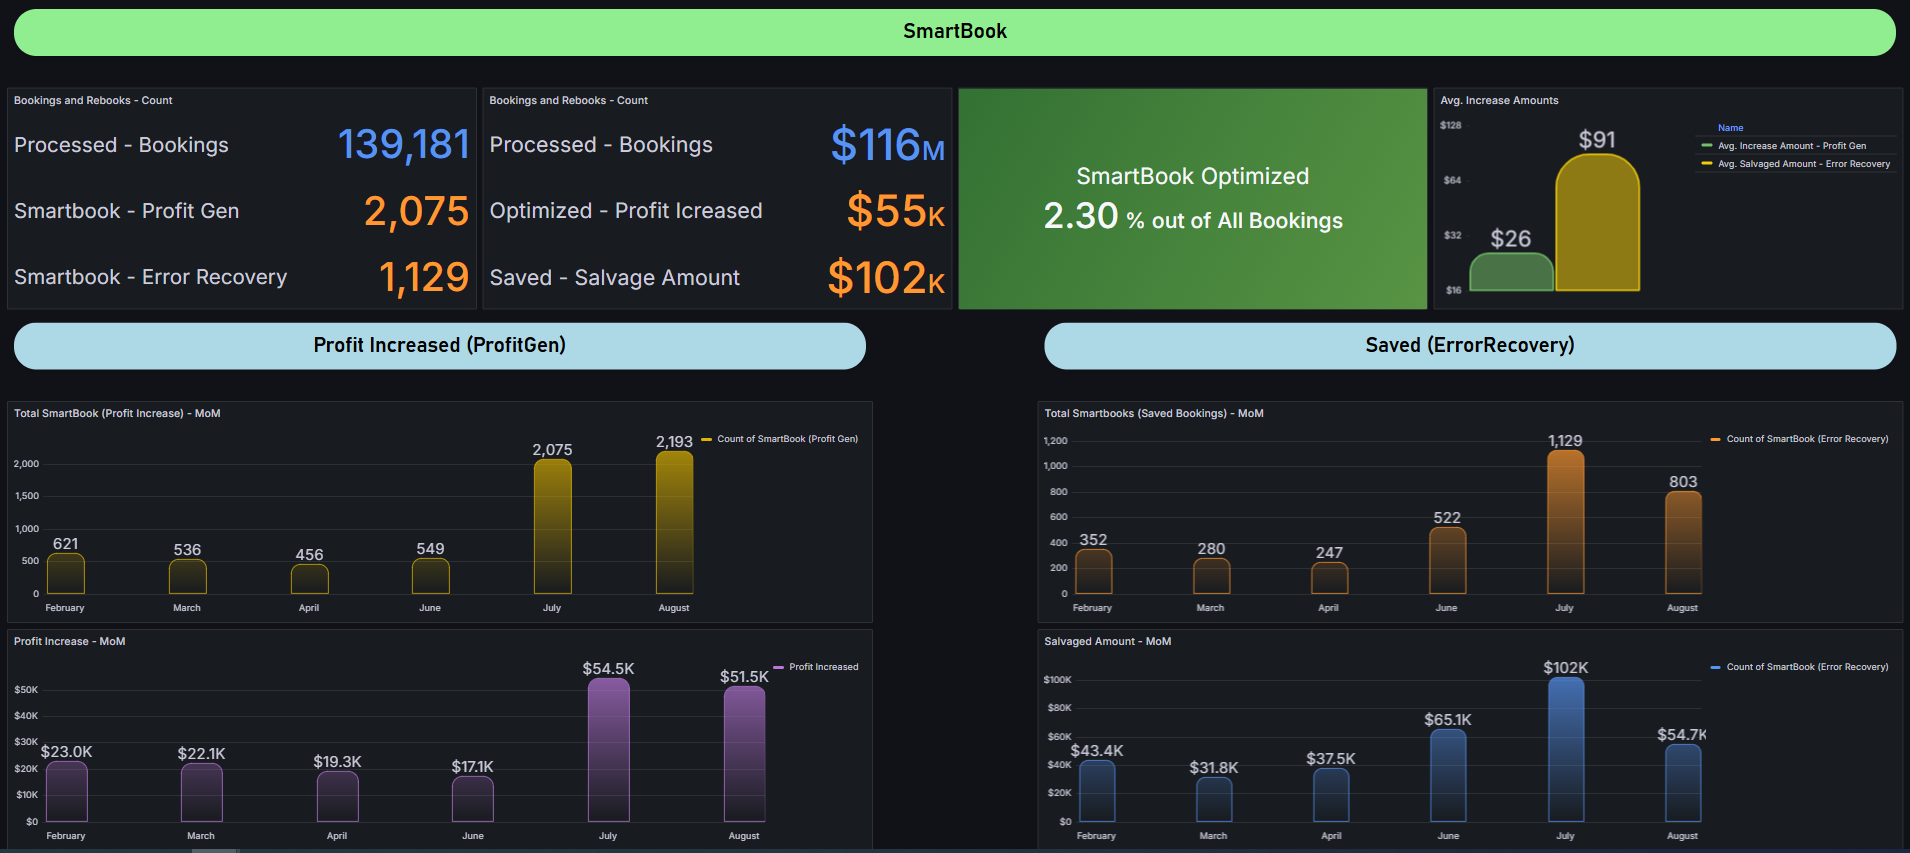
03 - SmartBook - Overview 🧠
Filtering Options : Dates, Status (Booking Status).
Overview of how Smartbook operates, including the volume of bookings it generated. The analysis includes month-over-month comparisons, presenting a table of bookings with both the amount of bookings and their increases, covering both ProfitGen and ErrorRevovery Modes. This data helps in understanding the efficiency and impact of Smartbook.
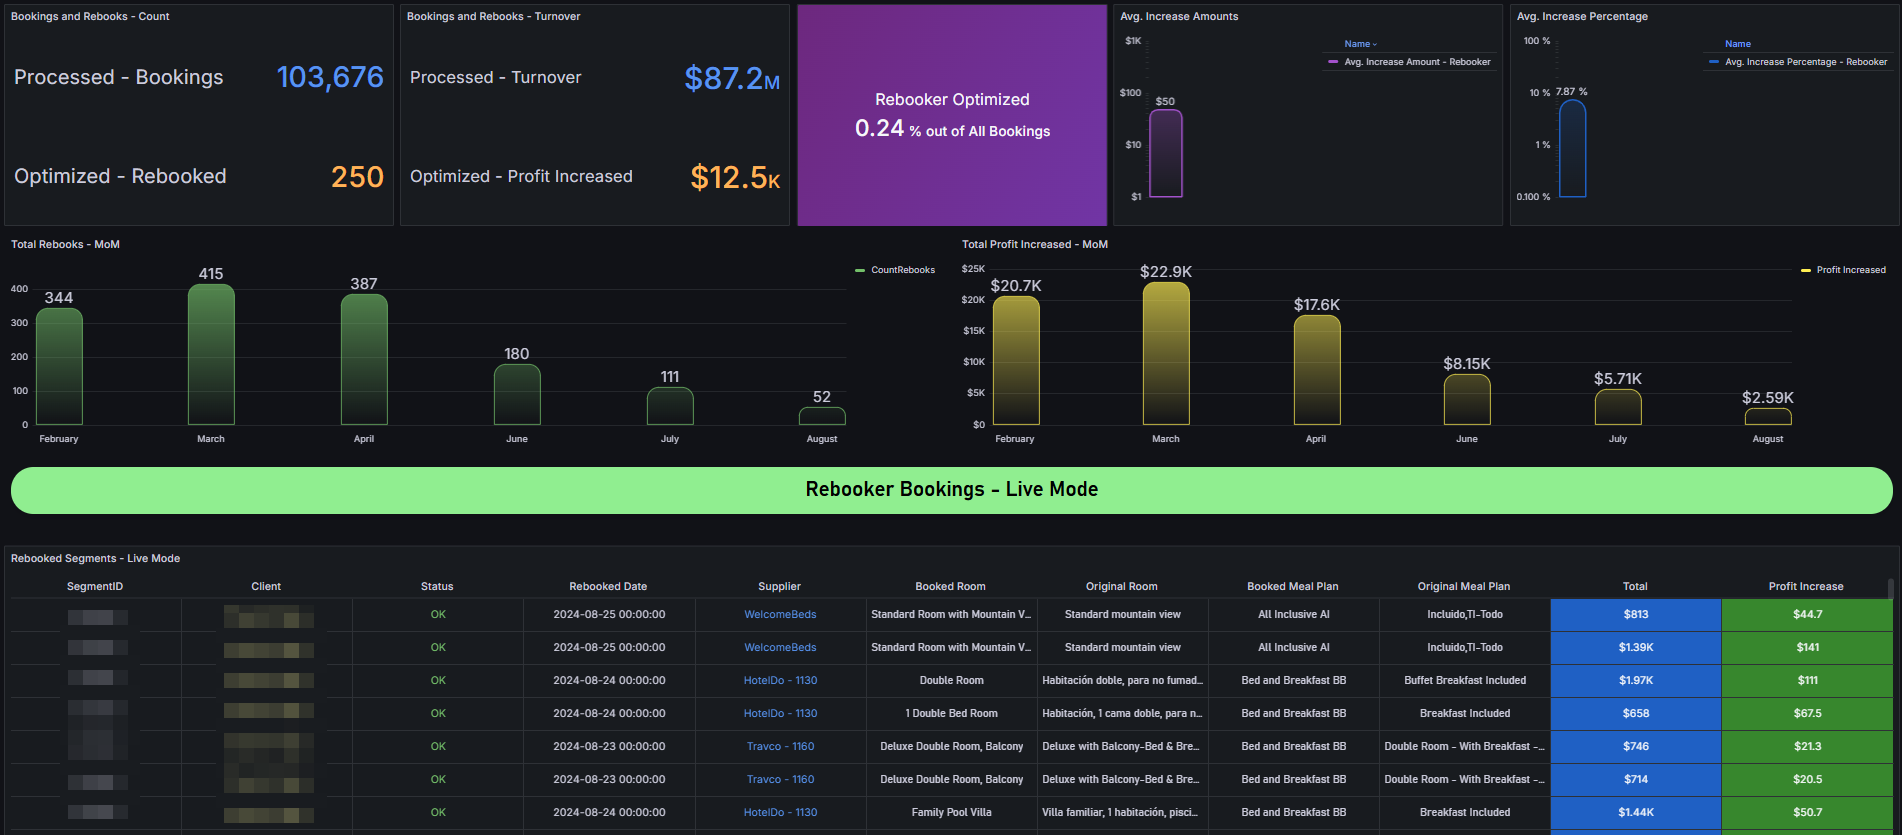
04 - Rebooker - Overview 🔄
Filtering Options : Dates, Status, Date Model (By Order Date, Check-In date or by Cancellation Dead-line).
Overview of how Rebooker operates, including the volume of bookings it generated. The analysis includes month-over-month comparisons, presenting a table of bookings with both the amount of bookings and their increases, covering both Live and Evaluation Modes. This data helps in understanding the efficiency and impact of Rebooker.
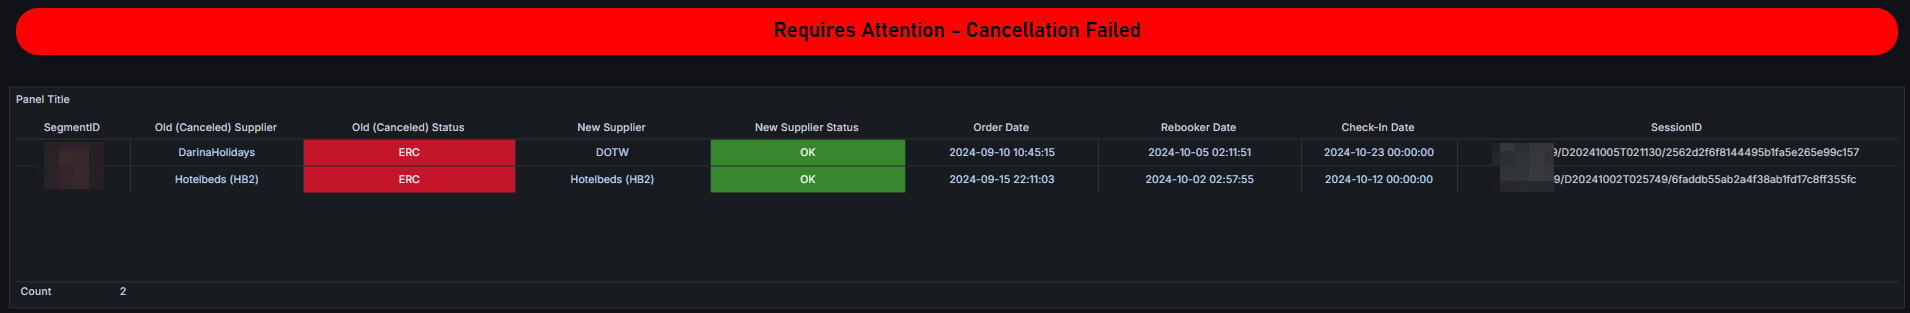
Requires Attention Section
Provides a valuable section for segments with failed cancellations from the previous supplier, offering an easy way to view and manually manage ER and ERC.
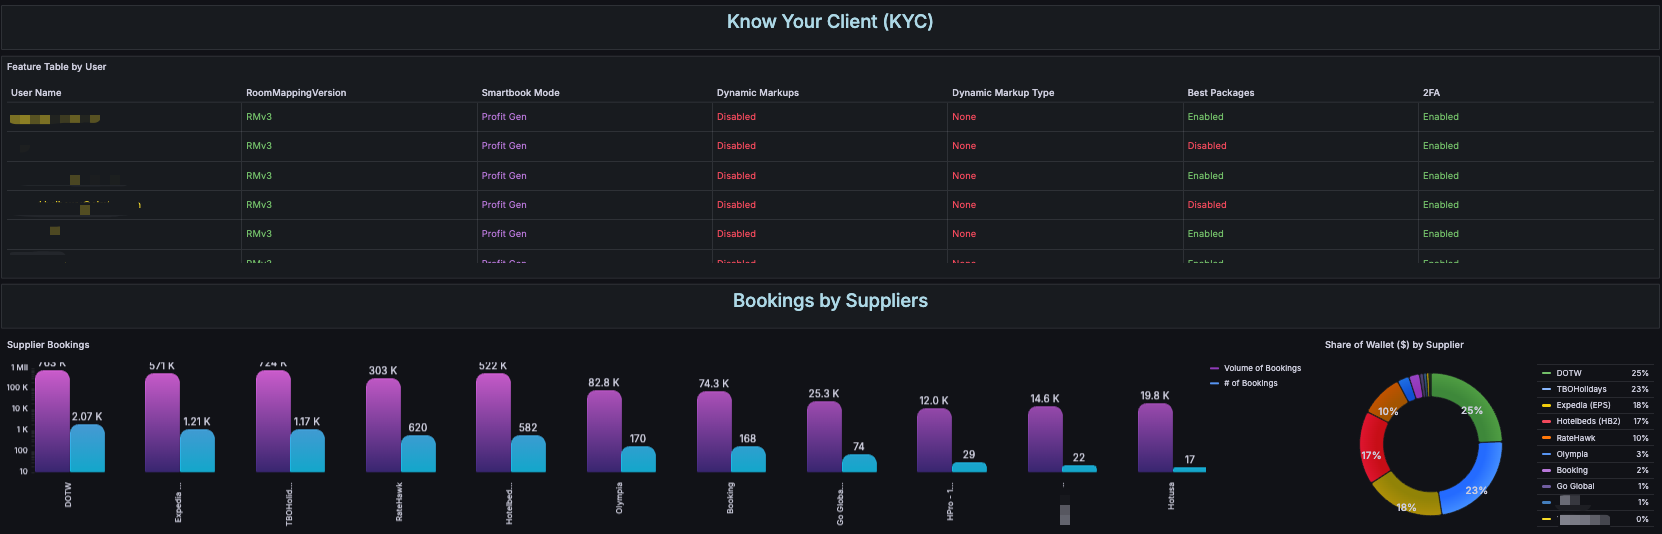
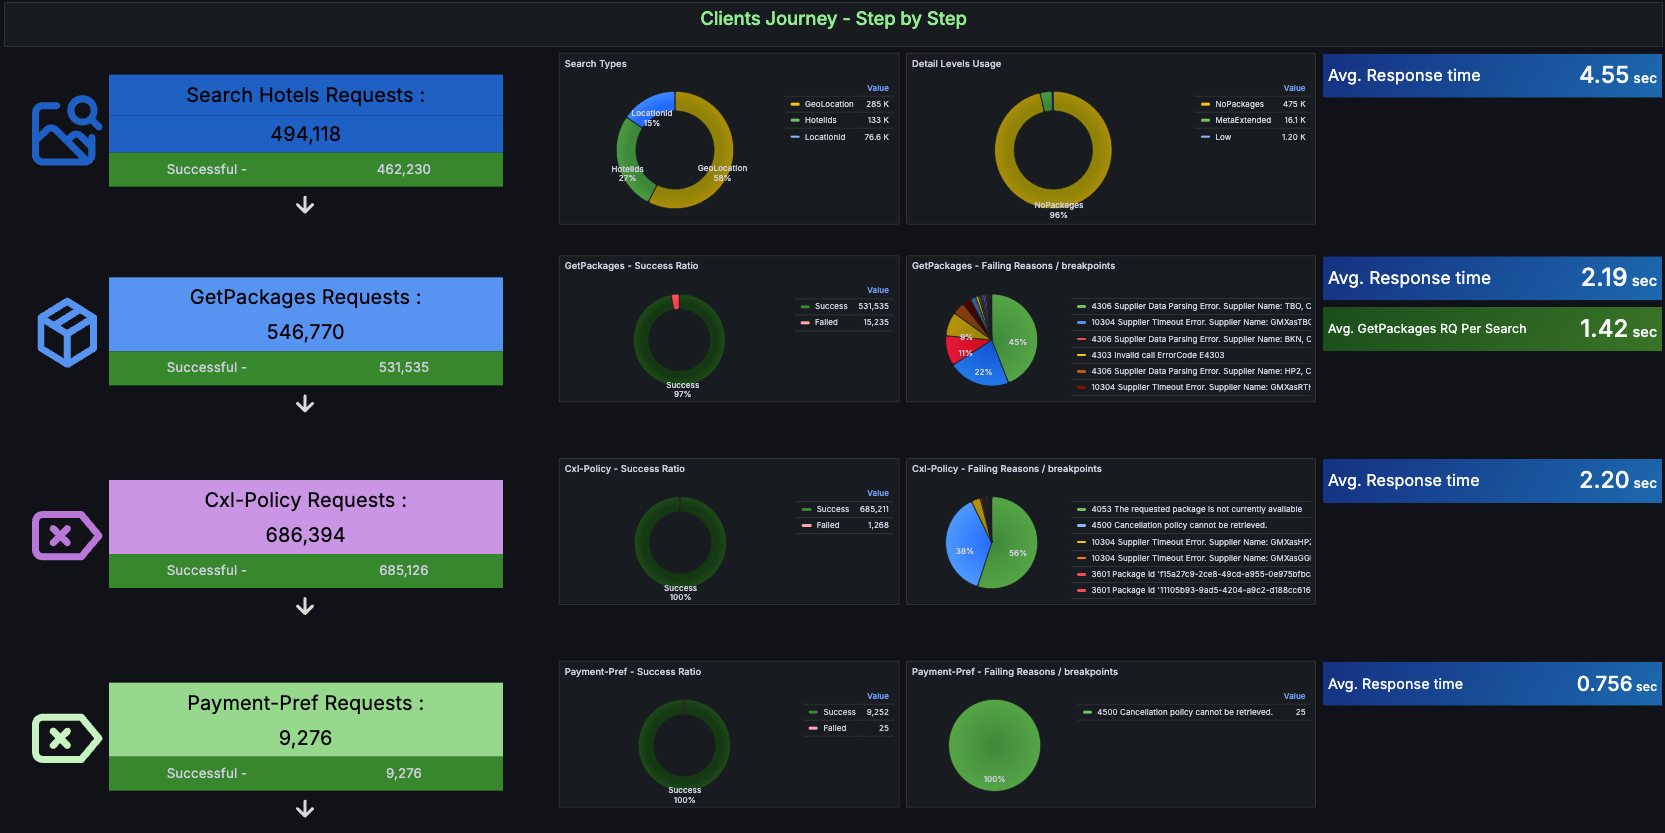
05 - Clients Journey & API Overview ⚙️
Filtering Options : Dates.
A detailed analysis of your users and their settings, a breakdown of bookings by supplier, and a full API flow assessment—including success ratios, common errors, and average response times across your API funnels.
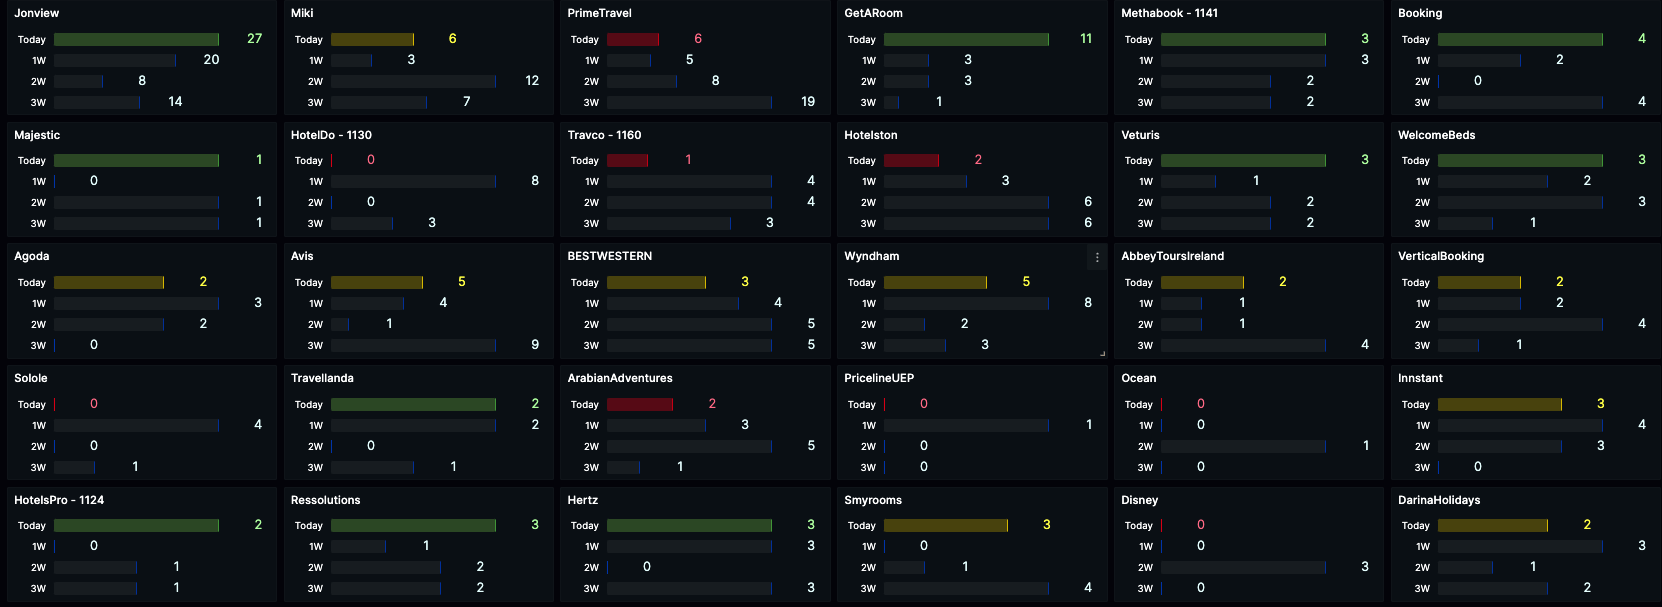
06 - Bookings by Supplier
Filtering Options : None, locked on Today so far.
Displays bookings categorized by suppliers for today, alongside comparisons to the same day 1, 2, or 3 weeks prior. It offers an understanding of your booking distribution across suppliers and identifies trends and ratios for different periods.
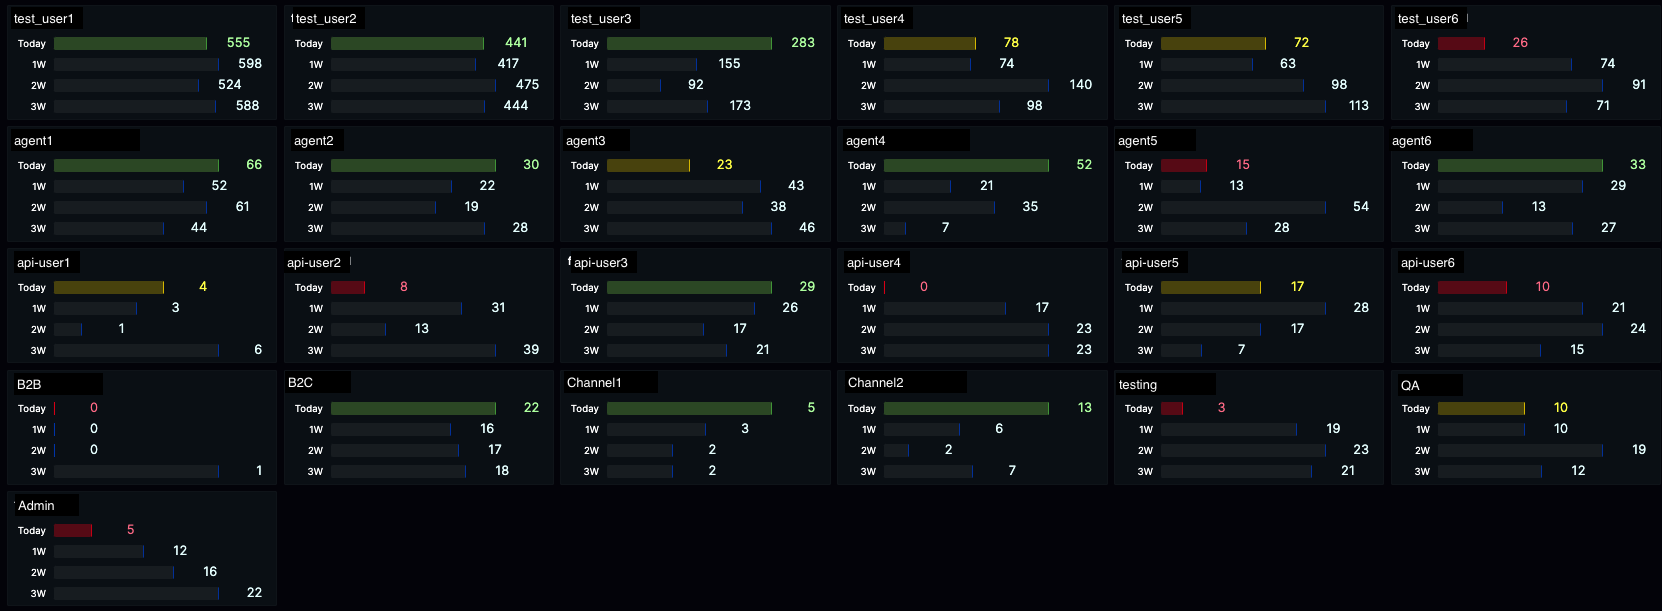
07 - Bookings by Users
Filtering Options : None, locked on Today so far.
Shows bookings categorized by users and API users for today, with comparisons to the same day 1, 2, or 3 weeks ago. It helps understand the distribution and trends of bookings among different users.
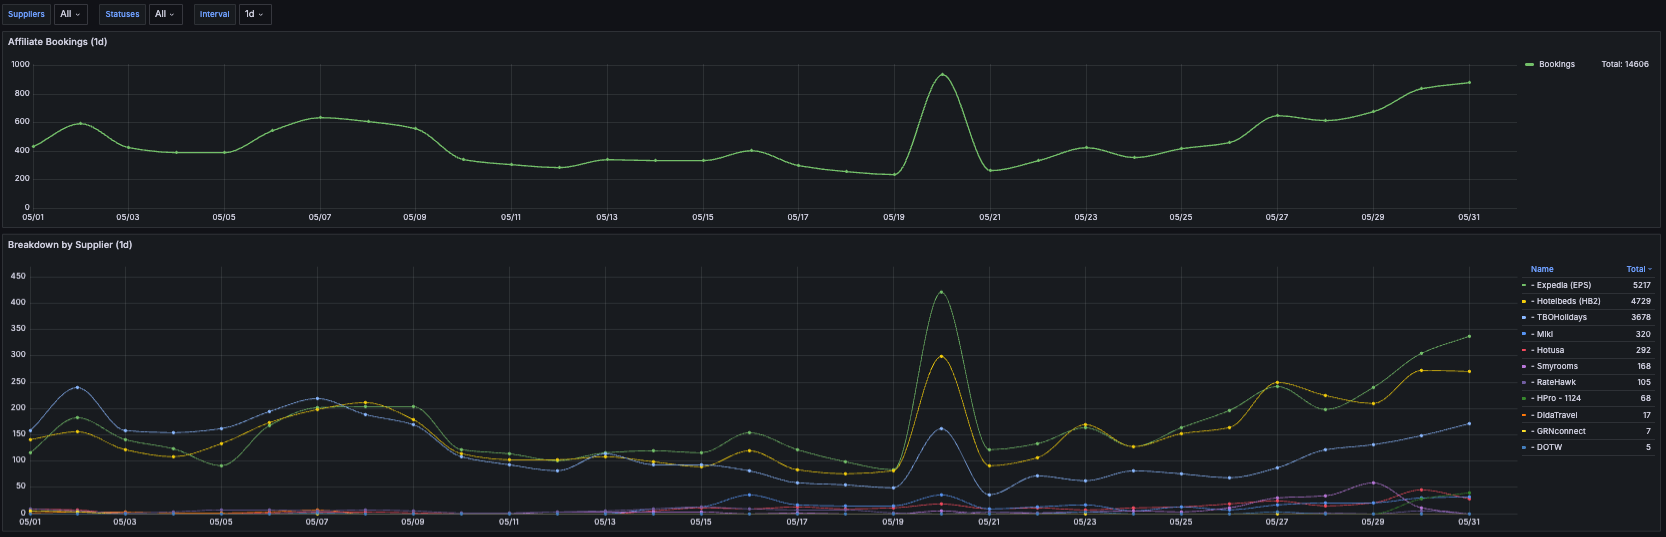
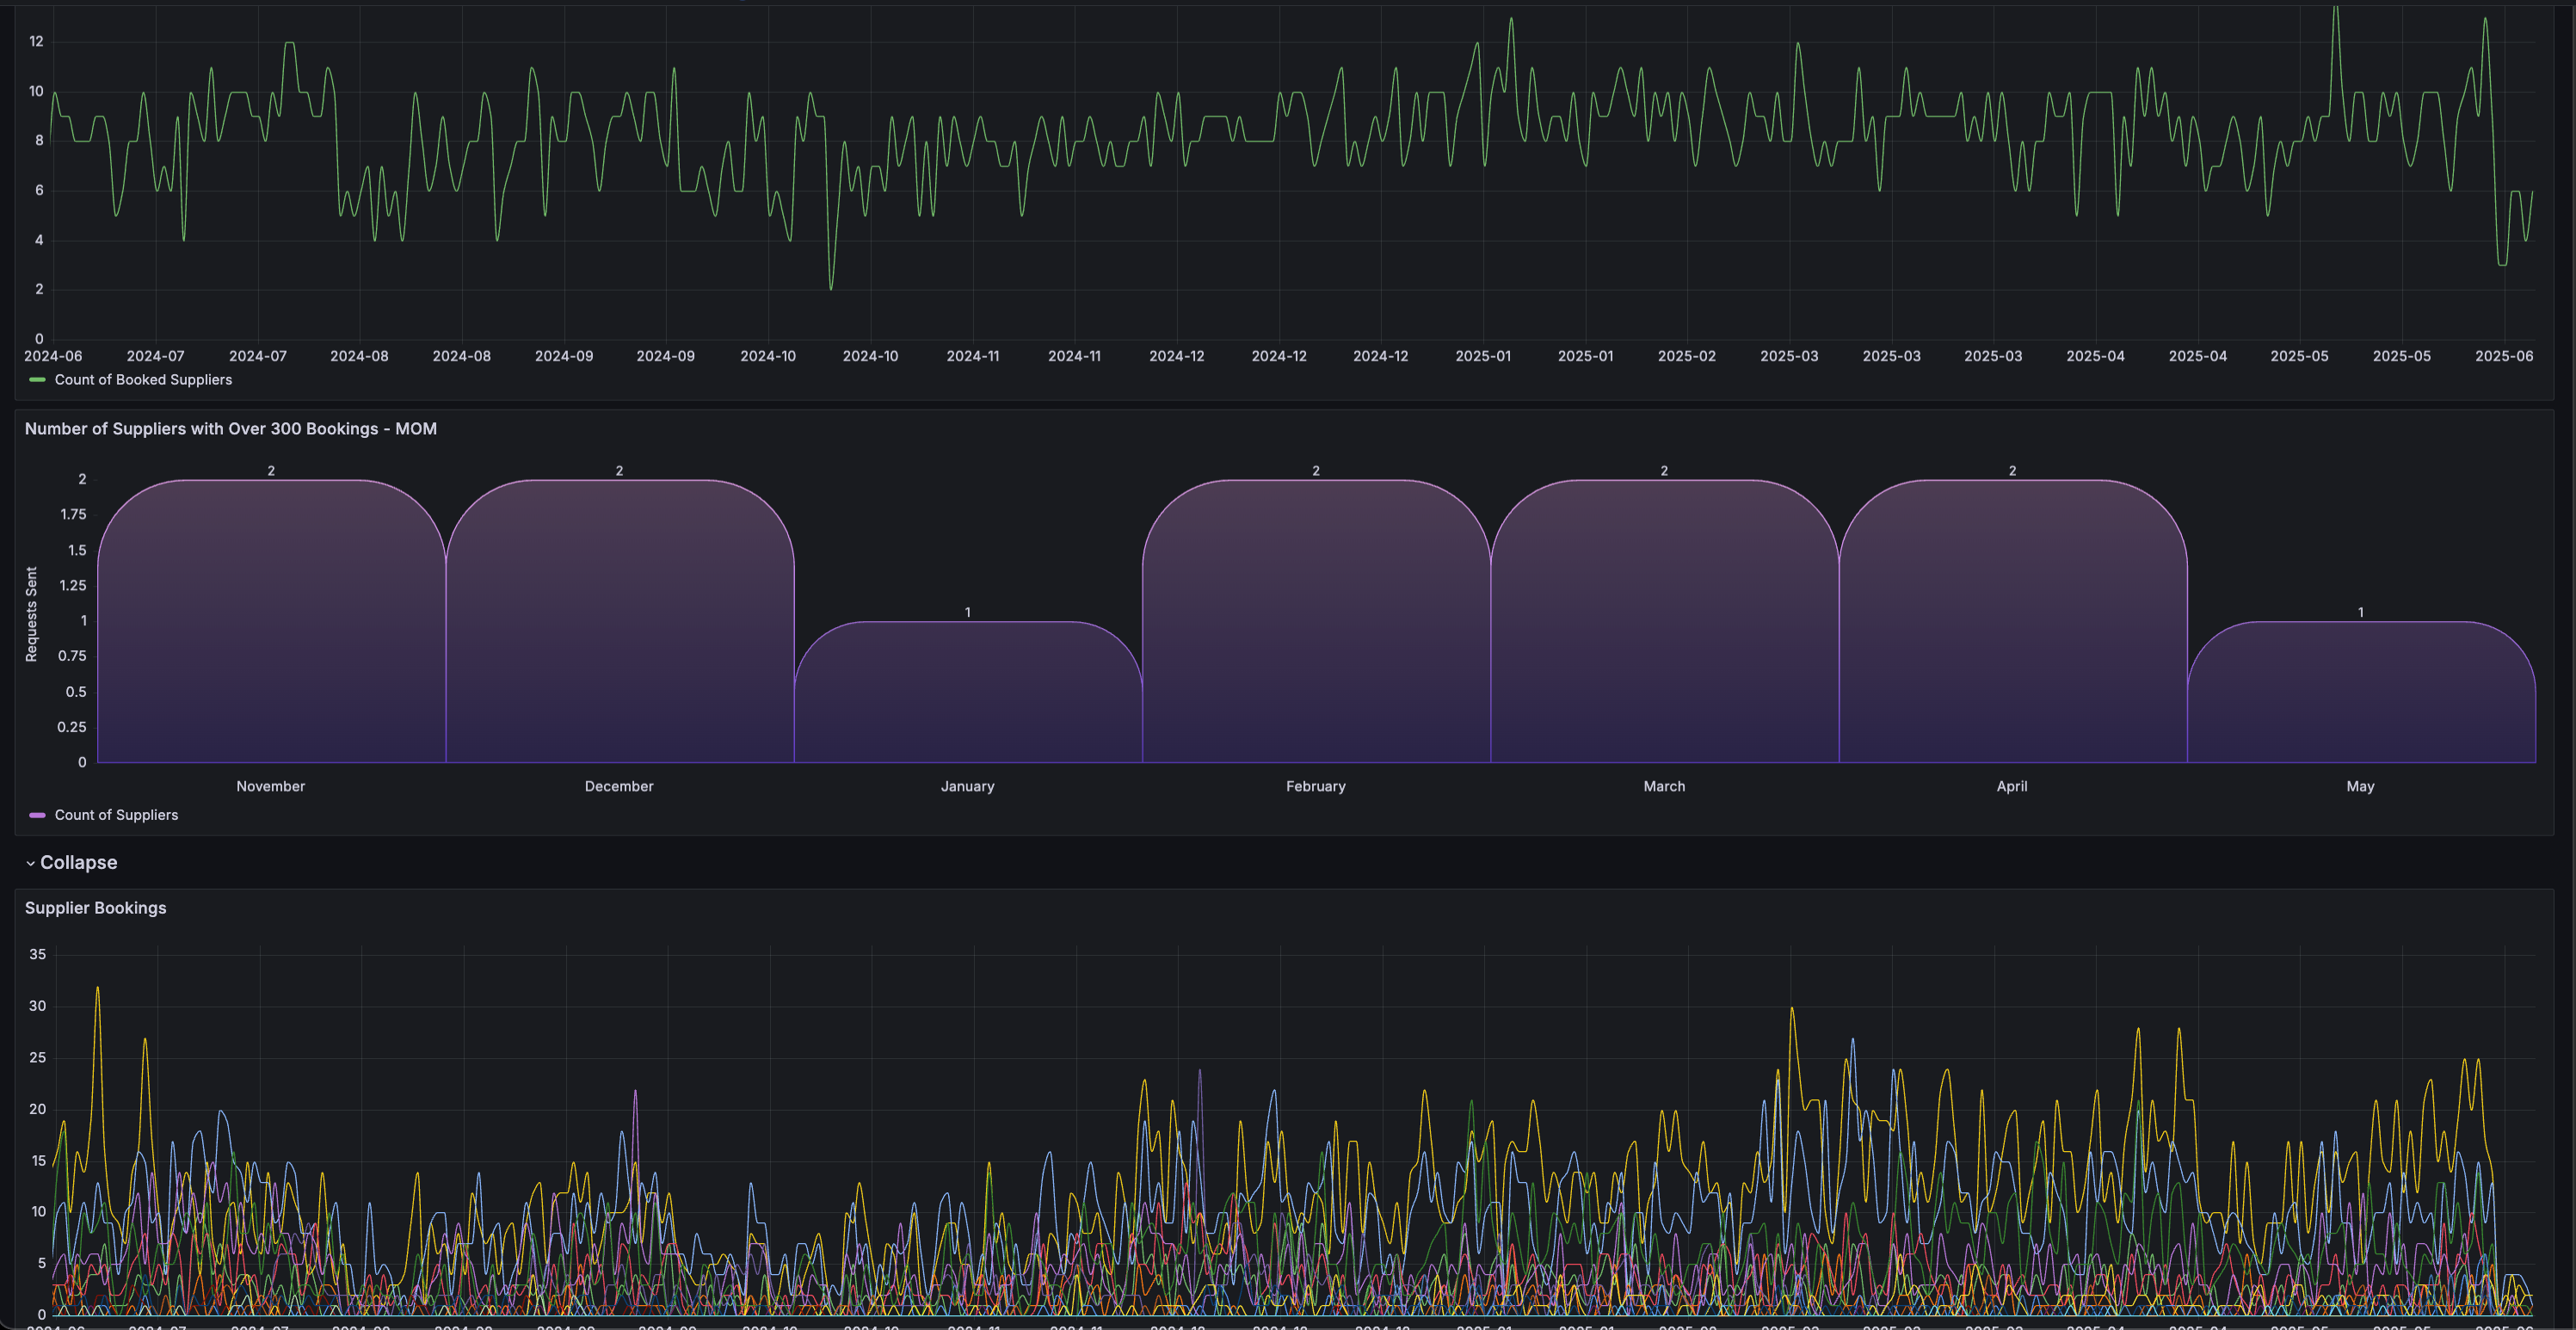
08 - Bookings Trends by Supplier
Filtering Options : Dates, Status, Supplier, Interval.
Your booking trends over time, broken down by daily patterns and supplier distribution, providing full visibility into bookings by supplier over time.
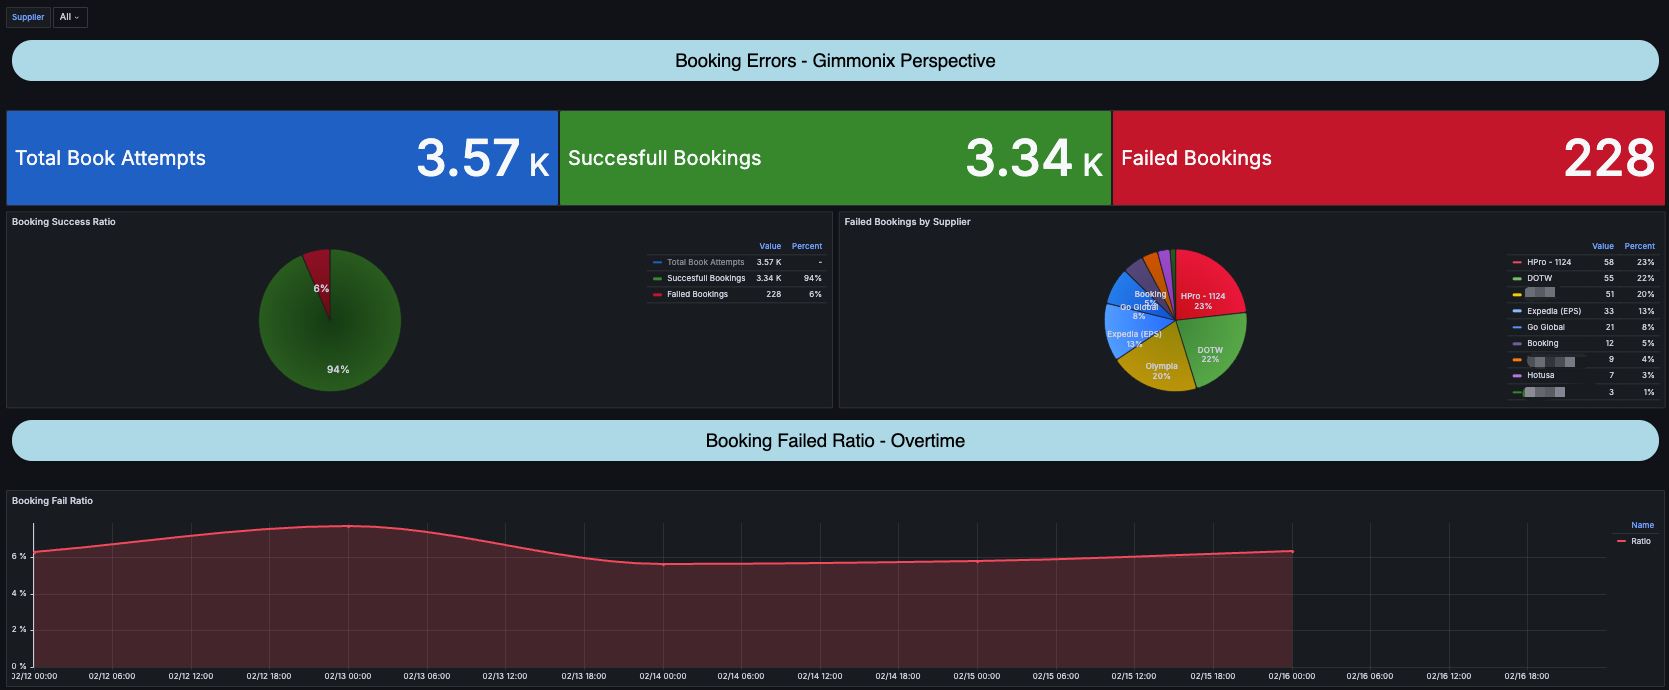
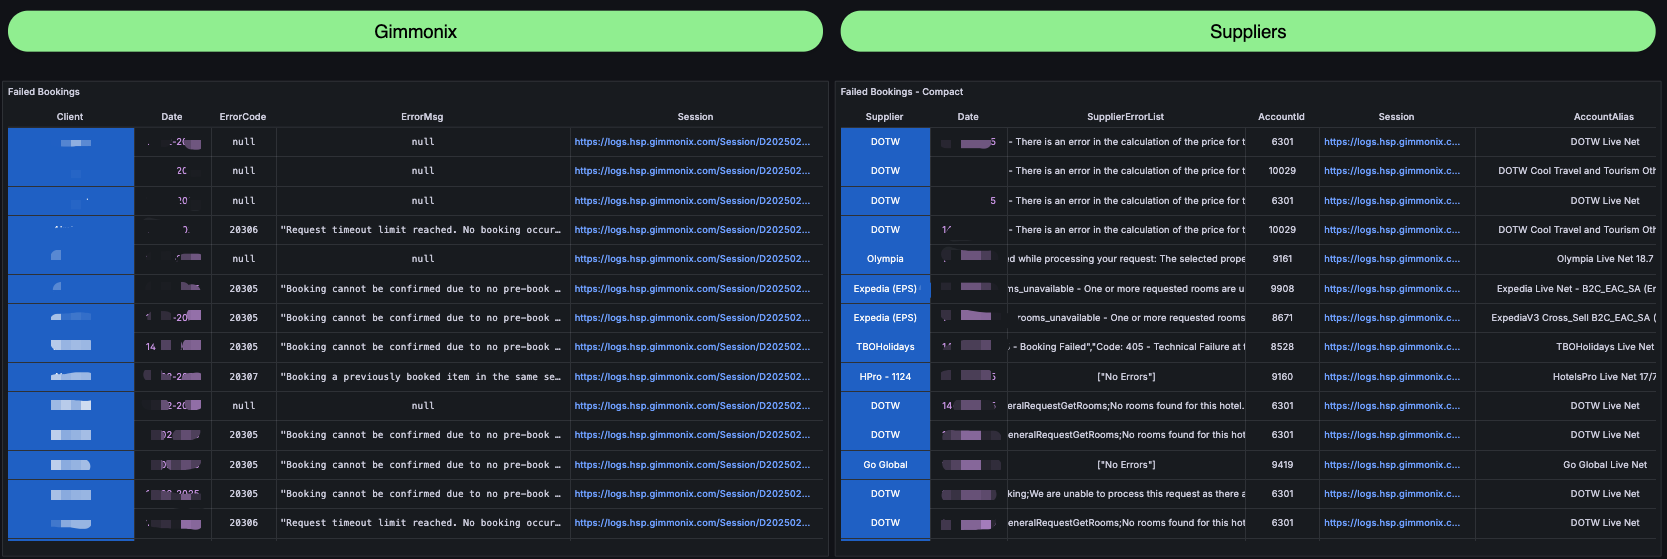
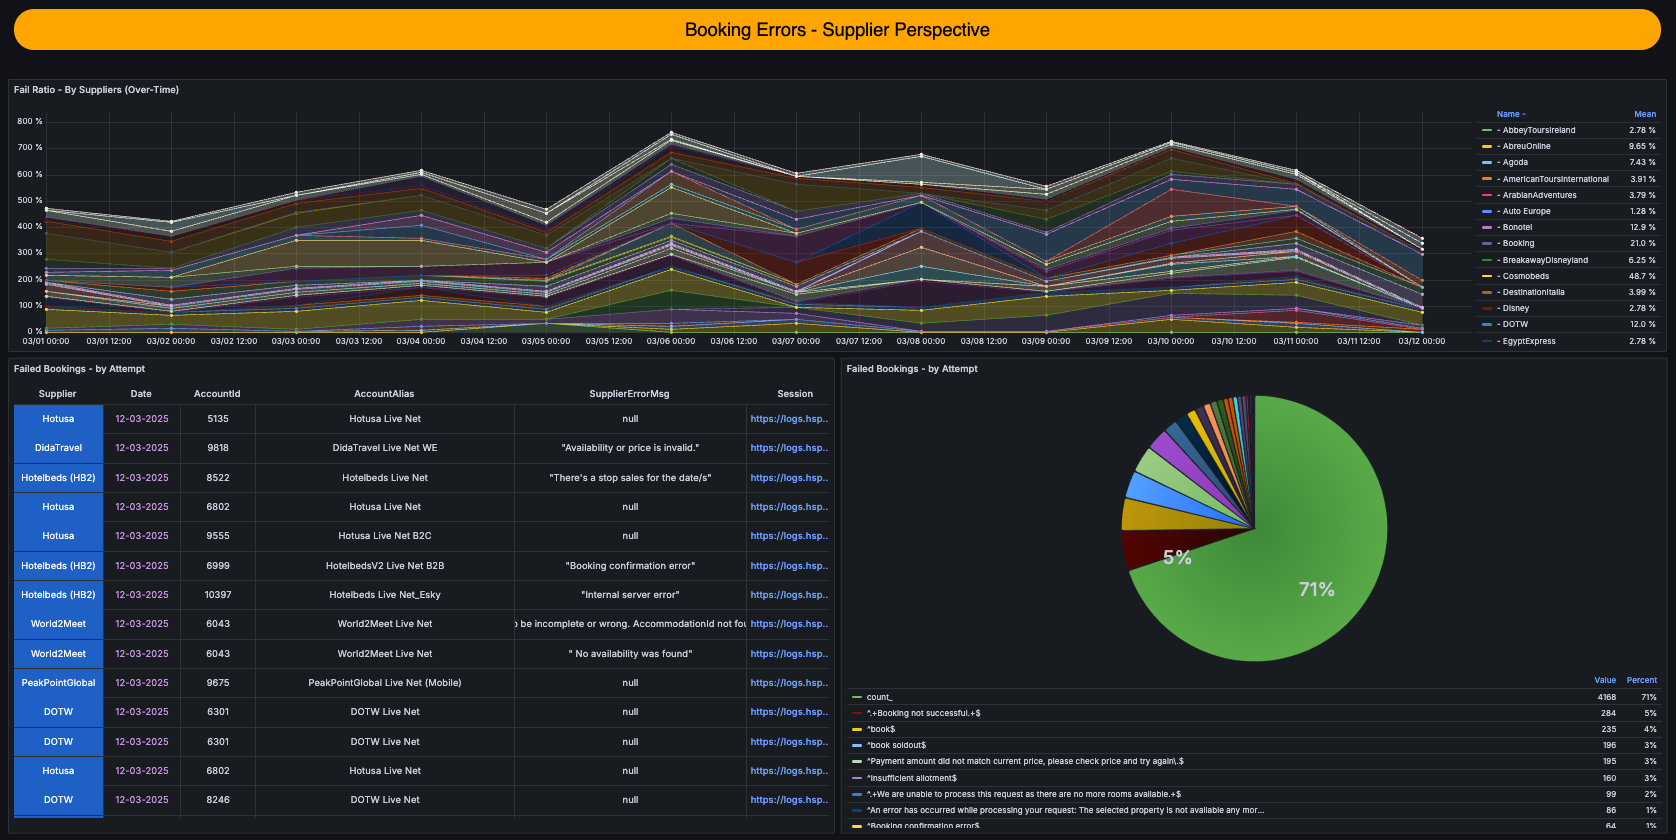
09 - Booking Errors ⚠️
Filtering Options : Dates, Supplier (Will only control the 'Supplier Perspective' Section).
A powerful dashboard that tracks booking success ratios over time, broken down by supplier failure rates and more. It provides insights into common booking errors and trends, allowing you to analyze different suppliers, trace session links, and dive deeper into the reasons behind booking failures—equipping you with concrete tools for better issue resolution.
10 - Client 360 - BreakDown
Filtering Options : Dates.
A shared data dashboard enables clients to contribute their data via ETL, allowing step-by-step comparisons across all API flows and detailed dropdown statistics.
Note -If you choose to share your data, this dashboard will display step-by-step comparisons between your data and ours for easy analysis - Please reach out to your CSM.
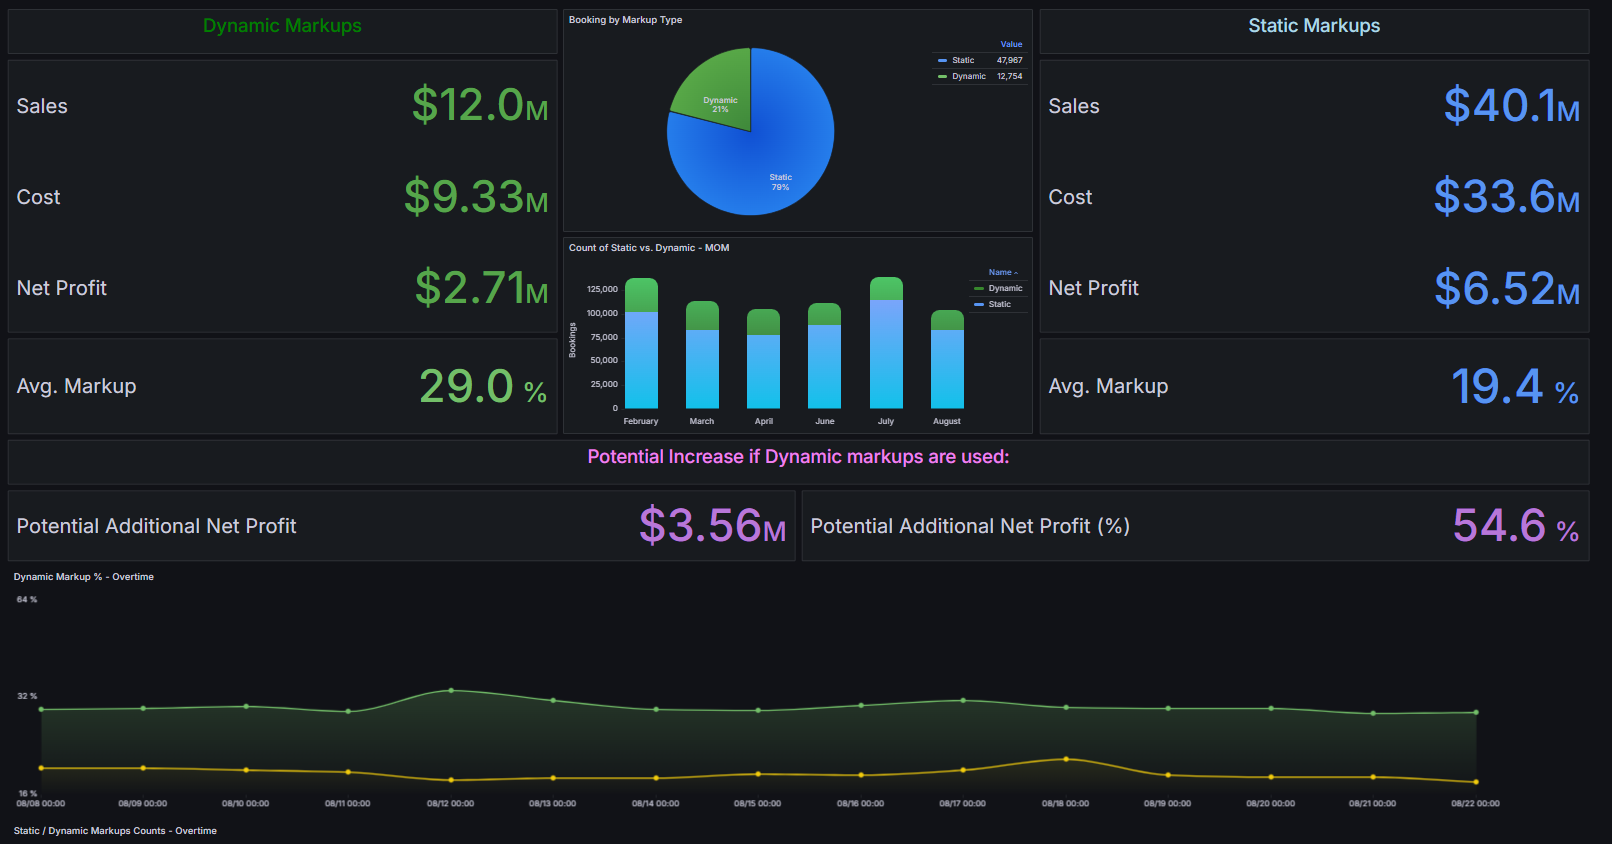
11 - Dyn.Markups per Client
Filtering Options : Dates, Node, User.
A comprehensive analysis of your booking distribution across Static and Dynamic markups, highlighting potential profits and a detailed breakdown by suppliers—particularly relevant for clients utilizing the Dynamic Markup feature.
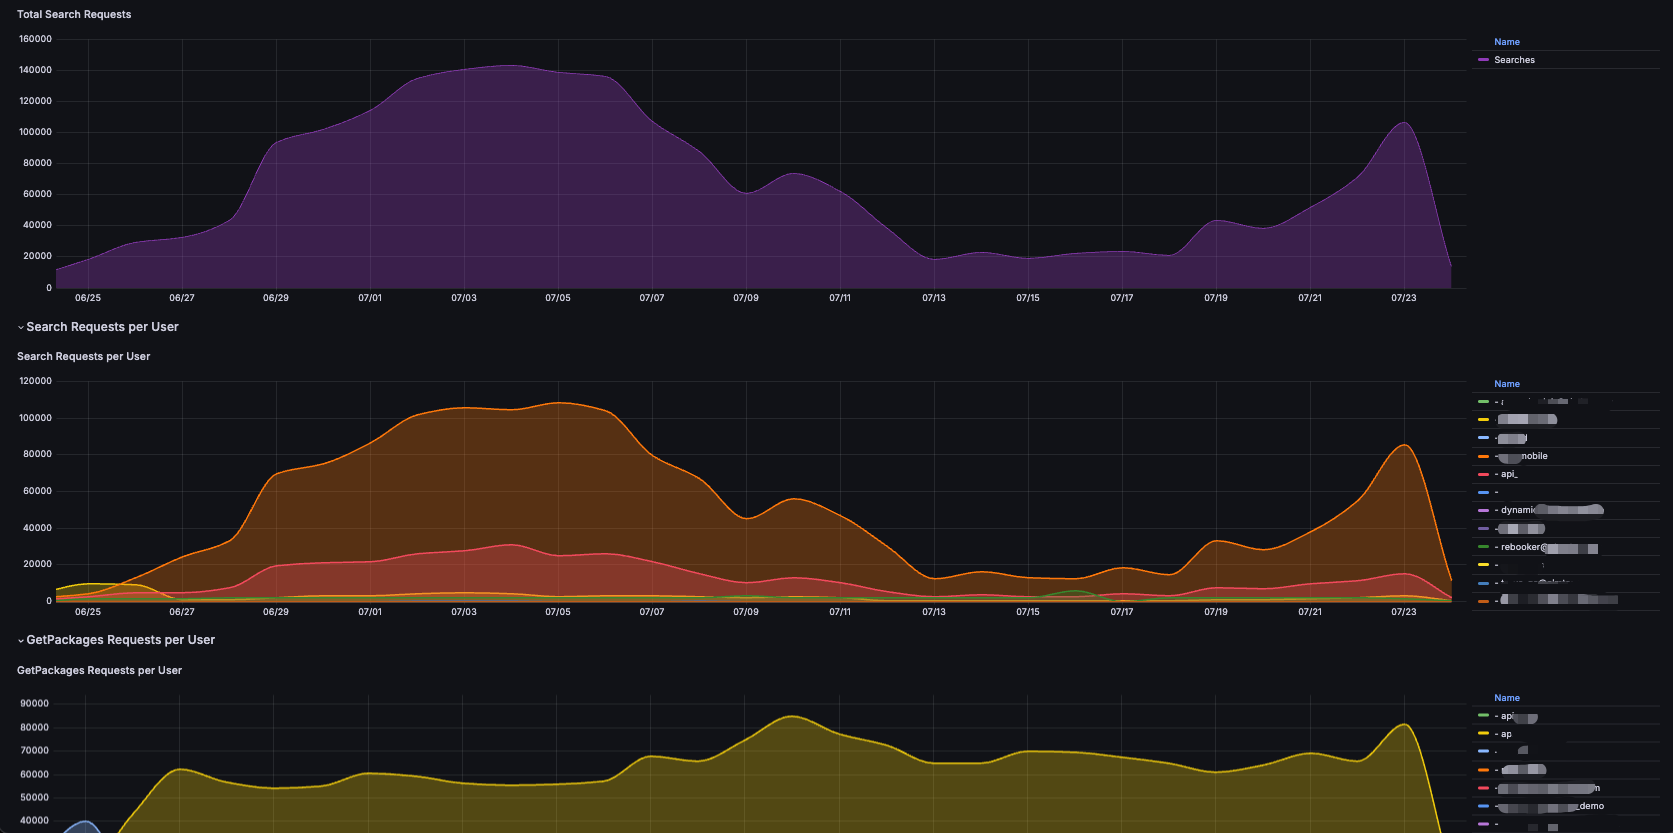
12 - Transactions - Per User Per Client
Filtering Options : Dates, Time bin.
Displays transactions categorized by users over time. It provides insights into the distribution of searches, GetPackages, Cxl-Policy, and bookings across users, helping to identify trends over different periods.
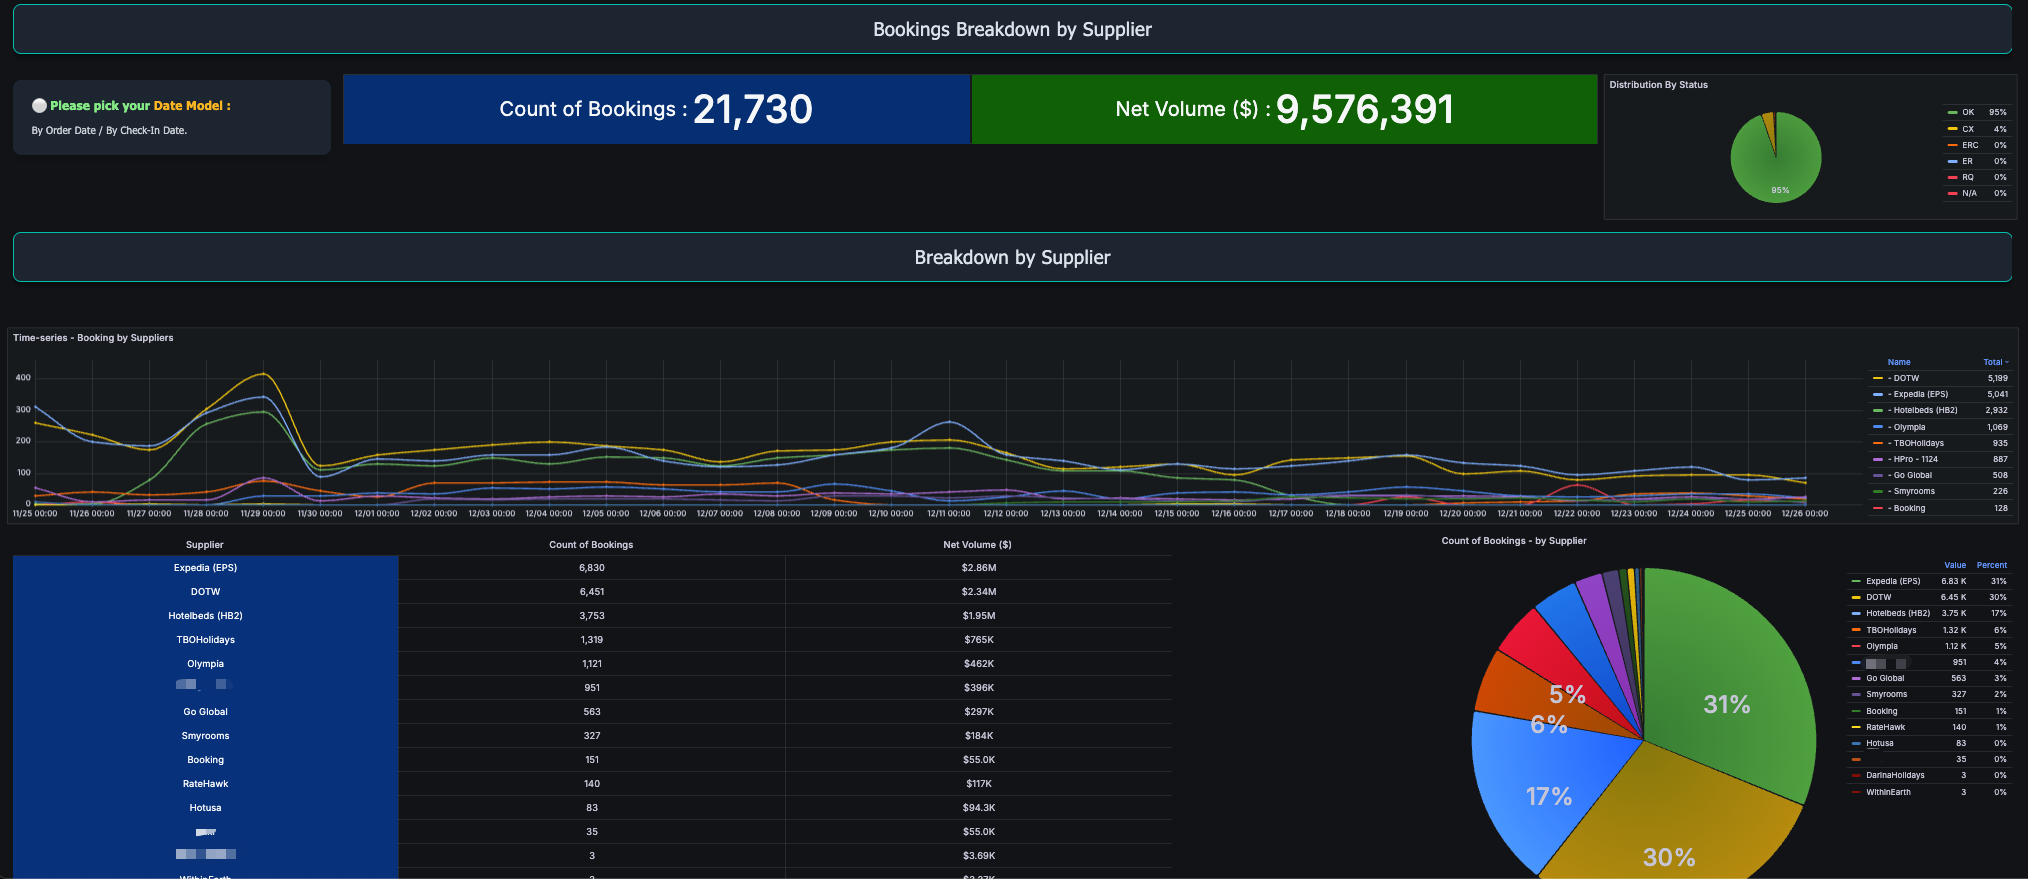
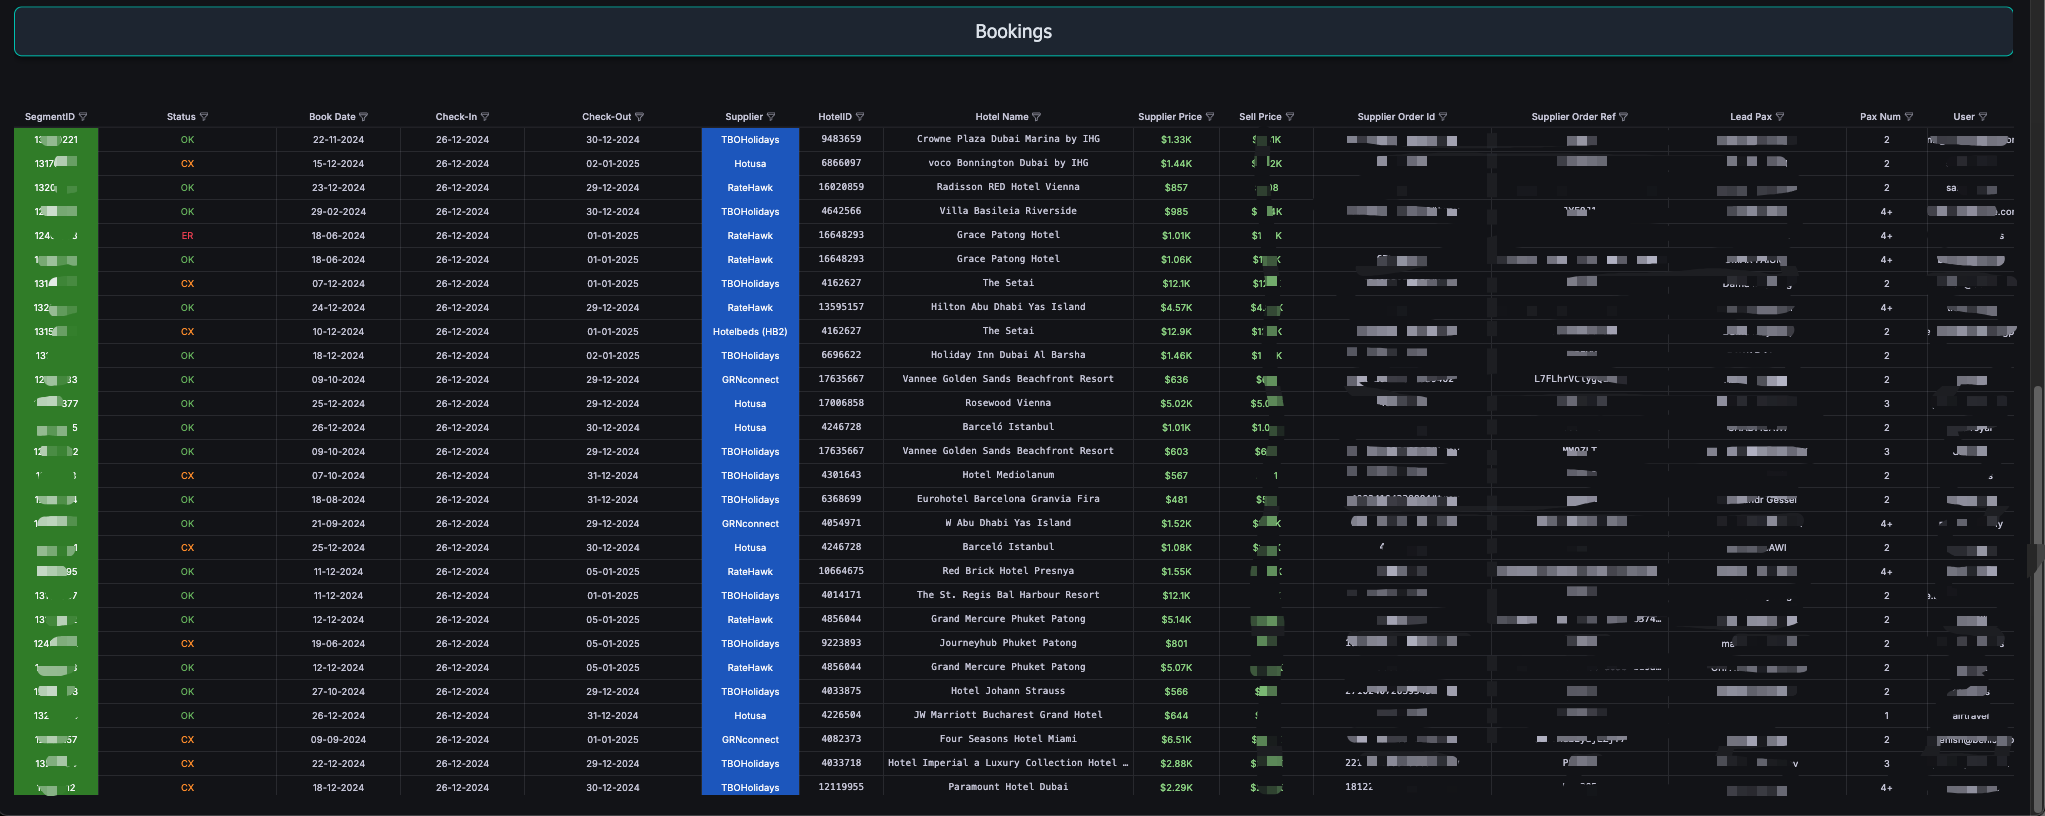
13 - Bookings Breakdown by Supplier (By Booking / Check-In Dates)
Filtering Options : Dates, Supplier,Date Model (Order date or Check-In date) ,Status.
Displays supplier booking data filtered by Order Date or Check-In Date, with customizable options for Suppliers, Segment Statuses, and Time Range.
Includes comprehensive views of booking statuses through supplier-level aggregations, time series charts, and pie charts. Also presents distinct booking details such as Net and Selling Prices, Check-In/Check-Out Dates, and more.
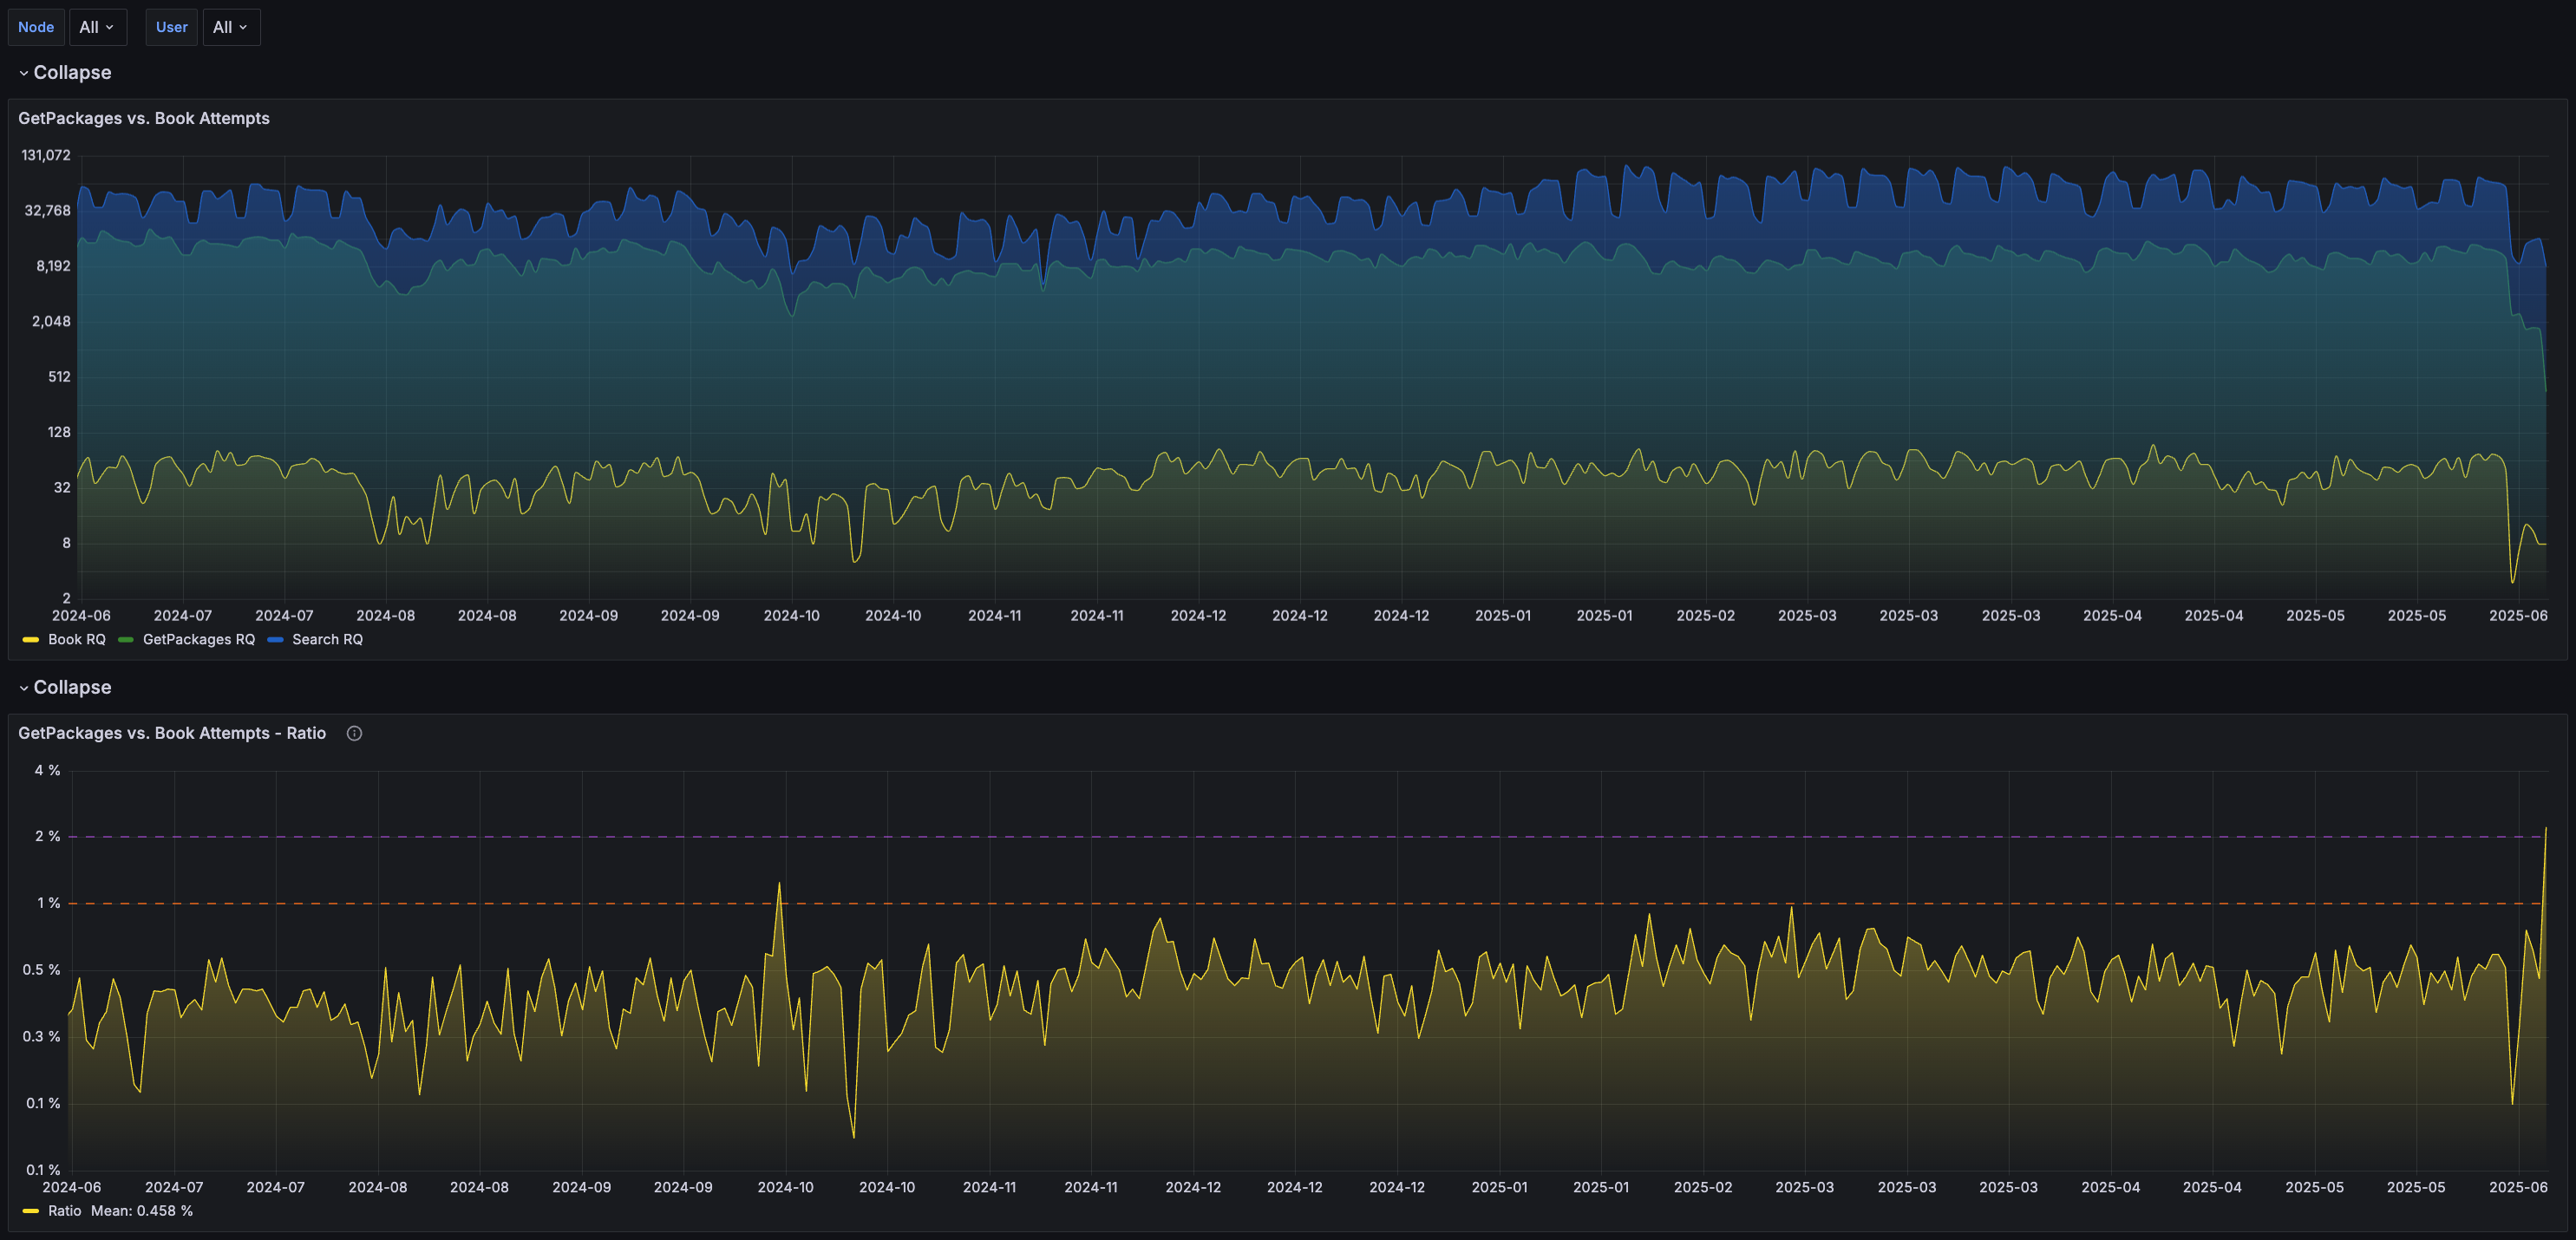
14 - Conversion Ratios
Filtering Options : Dates, Note, User.
The Conversion Ratios Dashboard monitors your performance overtime, including key metrics such as the conversion ratios from Search to Book and GetPackages to Book, failure ratios, supplier booking trends, and overall efficiency. It provides partners with valuable insights into how they’re performing, which suppliers impact their conversion rates, and the contribution of each factor to their overall results.
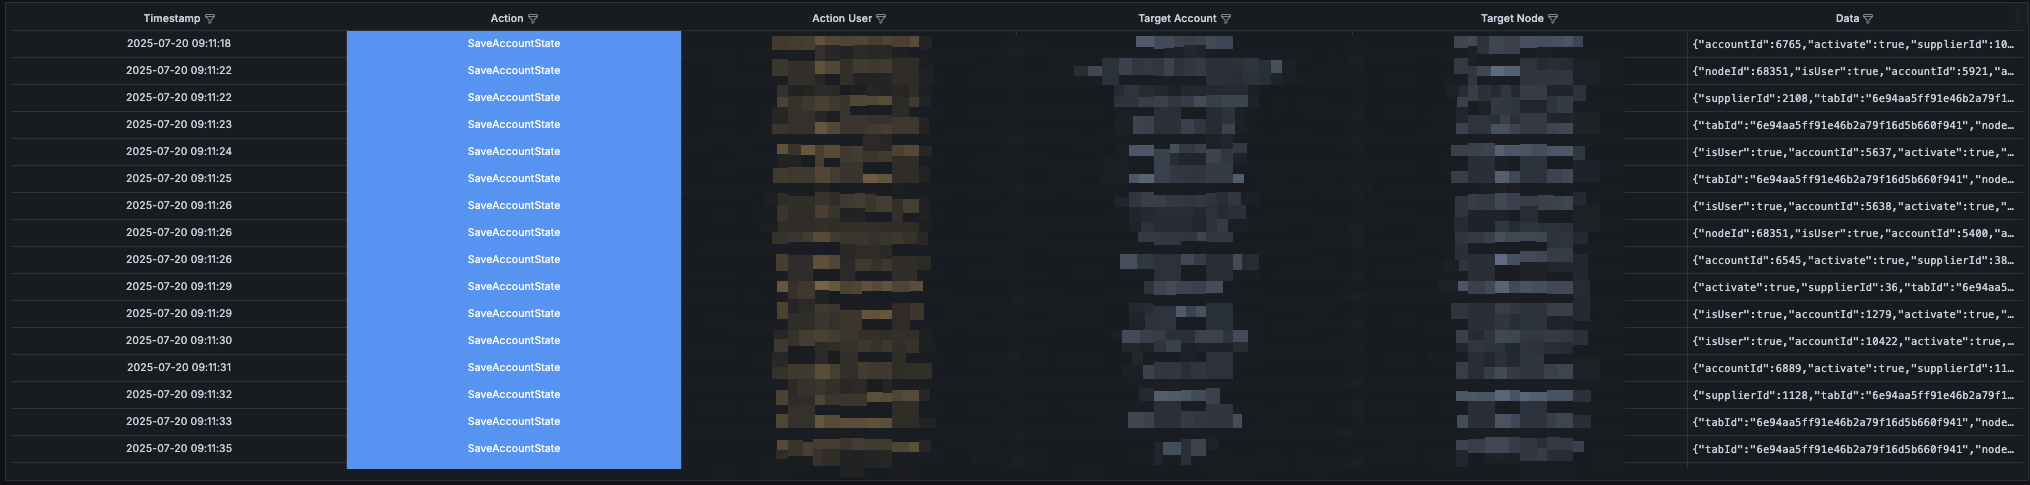
15 - Audit Actions - Markups and Accounts
Filtering Options : None
This dashboard tracks user activity related to markup changes, account activations and deactivations, and other key audit events. It displays all audit logs from the past 7 days and does not include filtering options.
Use this dashboard to monitor which users have applied or modified markups or accounts within the system.
Updated about 2 months ago