
BI.Works
Overview
Navigating the complexities of big data and extracting meaningful insights is often challenging.
BI.Works addresses this by offering a robust tool for analyzing, presenting, and summarizing data through easily understandable graphs and organized information.
It enables the exploration of trends and detailed filtering by various data filters .
With a range of visualization options like graphs, pie charts, and maps, known as 'Widgets,' BI.Works clarifies the actions made by client over time, enhancing decision-making with just a mouse-over on any widget revealing pertinent data.
How to use BI.WORKS
Main Screen
Once you sign in to BI.Works app - you'll notice 4 primary sections:
- Business.
- Research Errors.
- Technical.
- Inventory.
Understanding Filters
Filters appears on the top of each page, In addition to the default Filters like: ‘Dates’, ‘Supplier’, ‘Account’, ‘User’, there are more filters that can be selected under ‘Add filters’ dropdown list.
Filters that were selected will appear on the top banner:

In addition to the default Filters like: ‘Dates’, ‘Supplier’, ‘Account’, ‘User’, there are more filters that can be selected under ‘Add filters’
Filters that were selected will appear on the top banner.
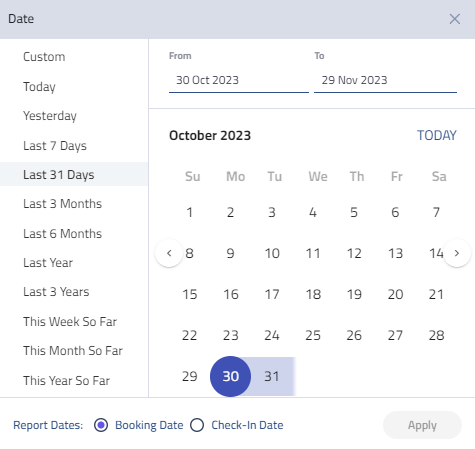
Dates range Filter allows to select dates by:
- Booking Date = Filter for reservations / searches according to the actual date the guest / agent made the reservations.
- Check-In Date = Filter for reservations / searches according to the check-In dates.
On the left side there are quick filter dates options, by selecting one of these options will change the dates automatically.
"i" Icon
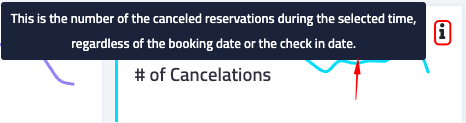
The “i” information presents a tooltip an additional information about the specific widget,
The additional information provides explanation or a note about the data / value it represent
Sections
1. Business section
The Business section is dedicated to providing data, insights, and visualizations specifically focused on bookings, SmartBook, Rebooker, and other business-centric analyses.
It facilitates the exploration of valuable financial and profitability metrics across different users and suppliers. This section allows for a comprehensive review of various performance indicators including time distributions, marginality, and more, tailored to enhance strategic business decision-making.
Bookings
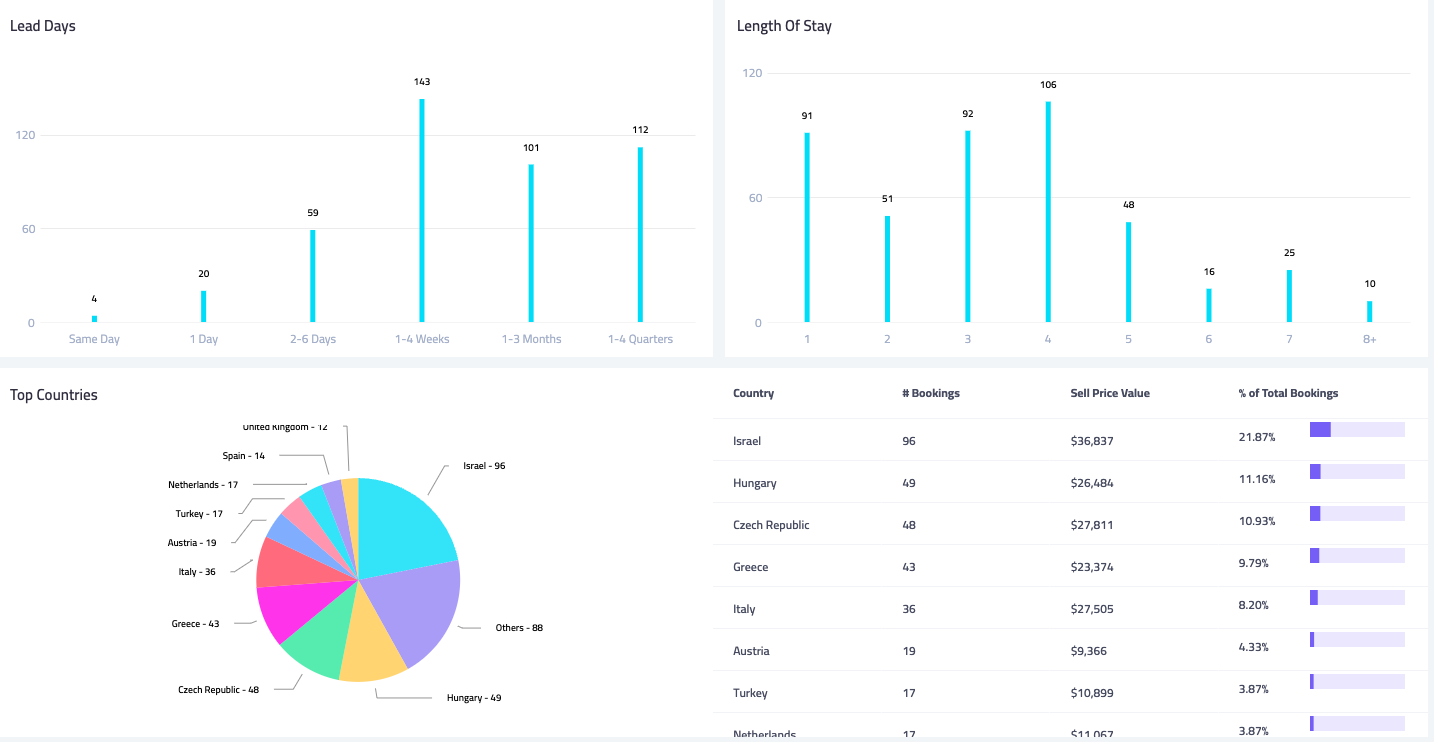
Overview
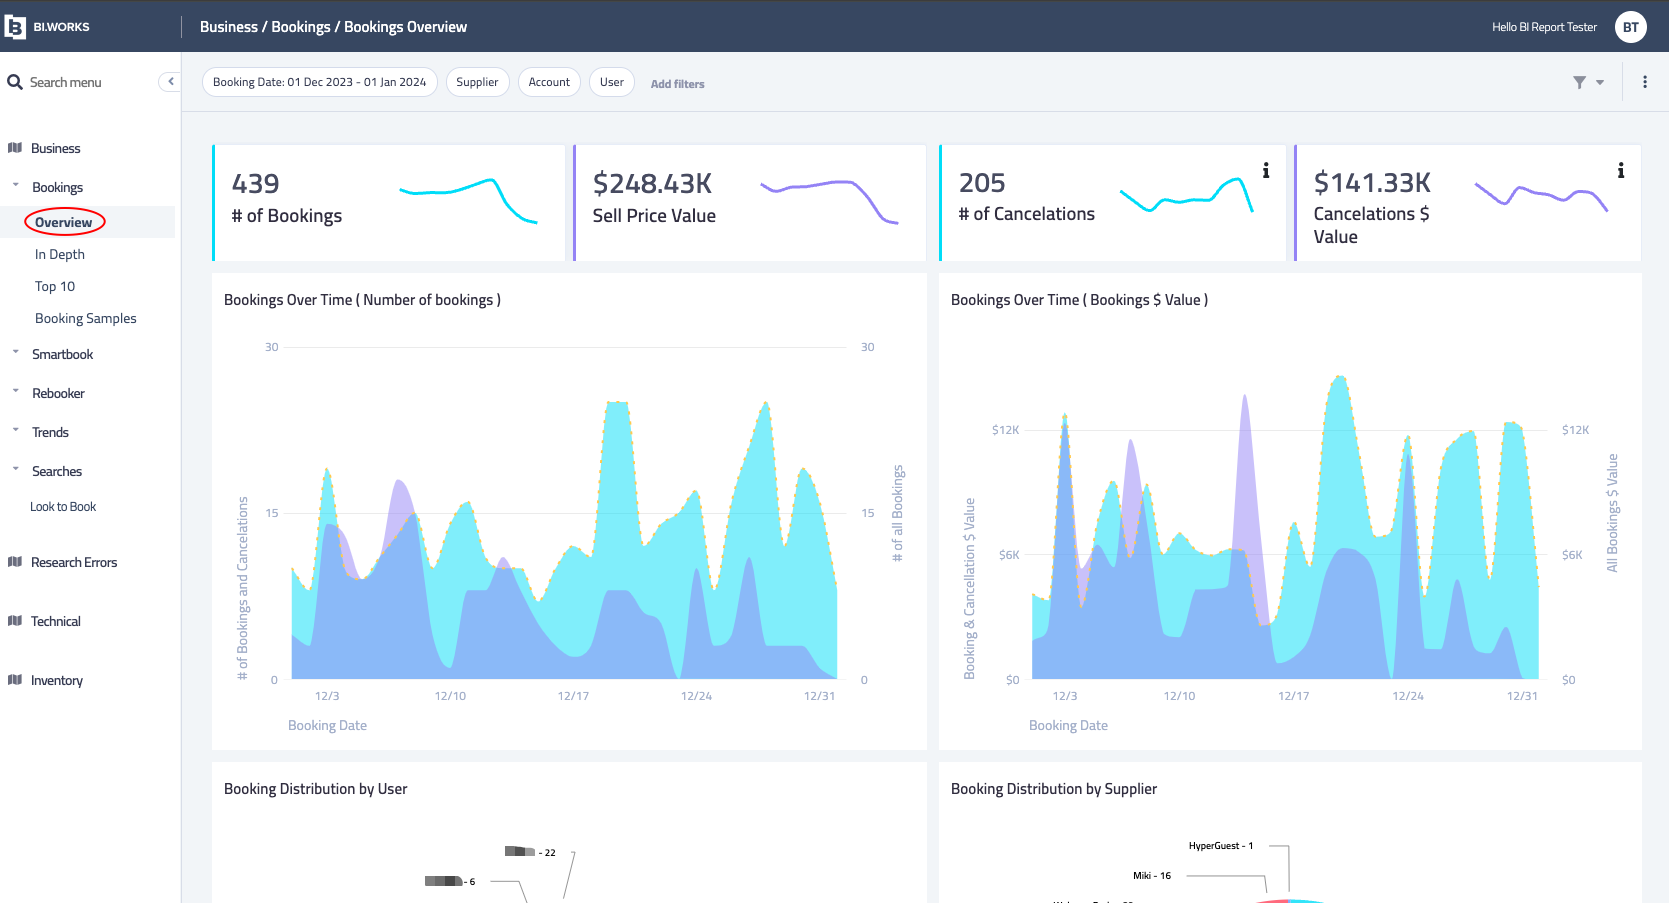
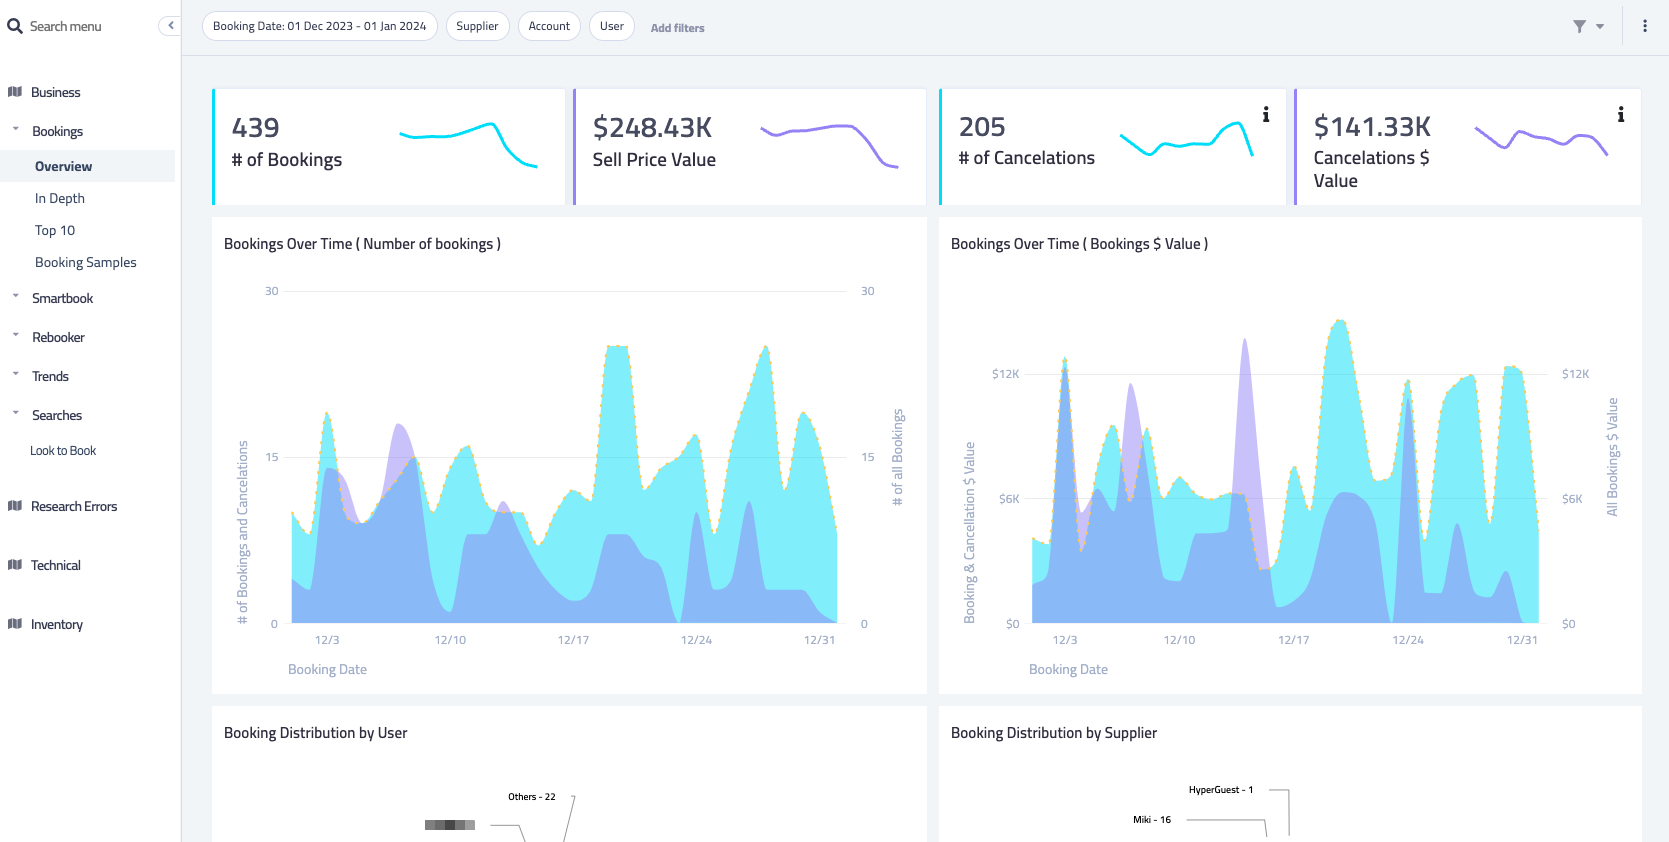
Overview Screen
The Overview Widget represents Bookings and Cancellations according to selected filters, split by Suppliers, Accounts and Users performance.
Along with crucial business insights, such as:
- User behavior: Lead days prior the booking & length of stay.
- Top countries booked by your users.
- Top cities booked by your users.
- More
Overview Example
In Depth
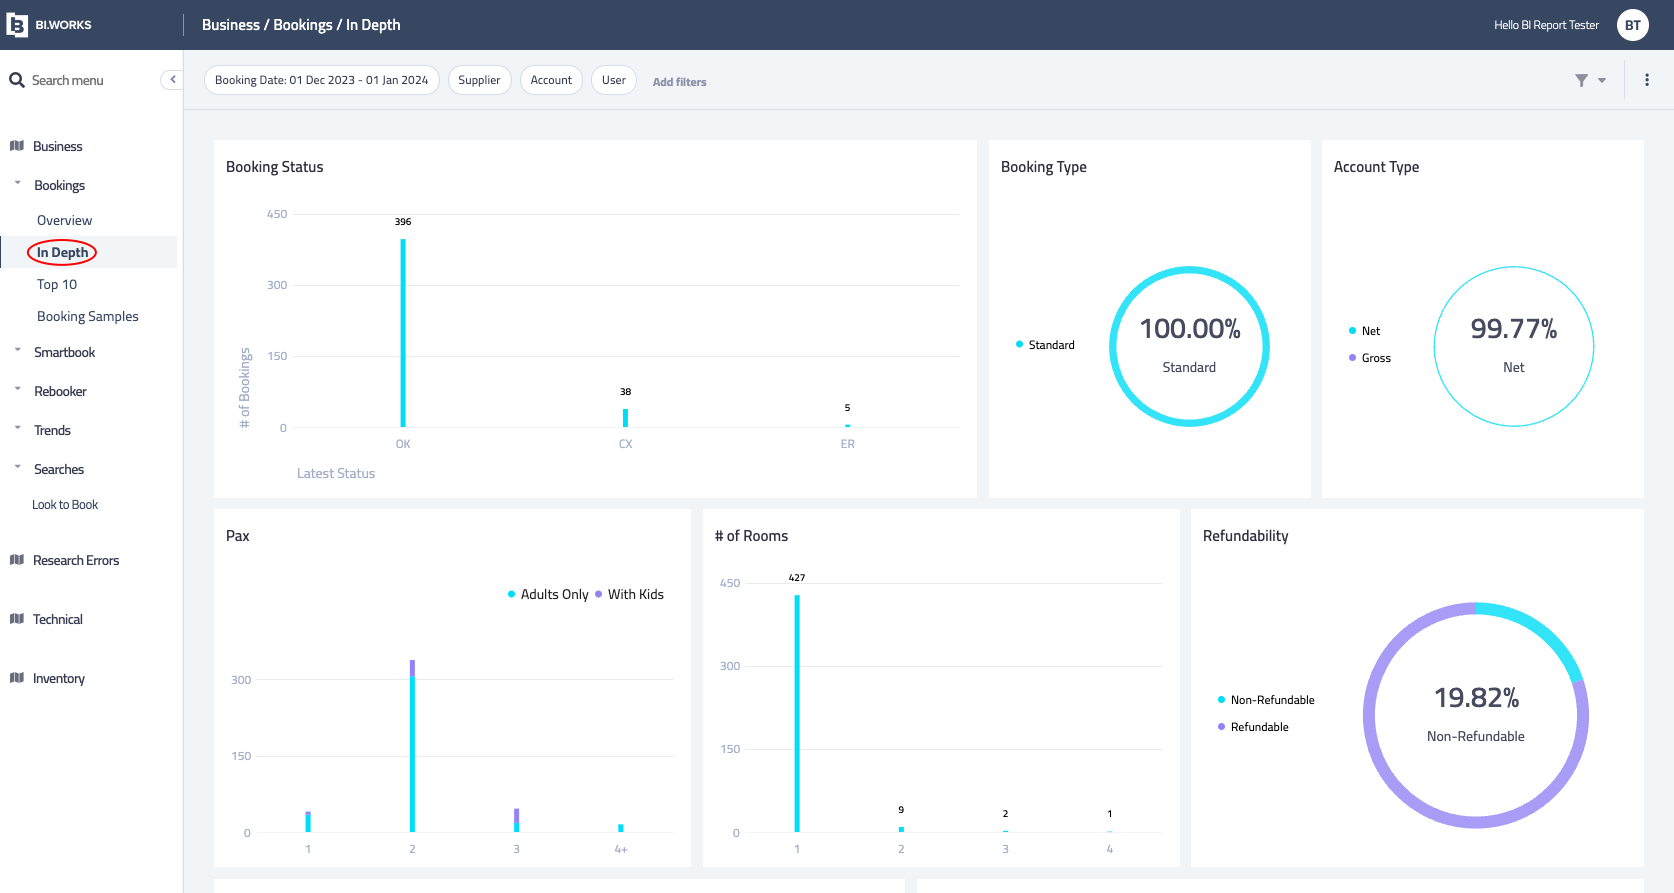
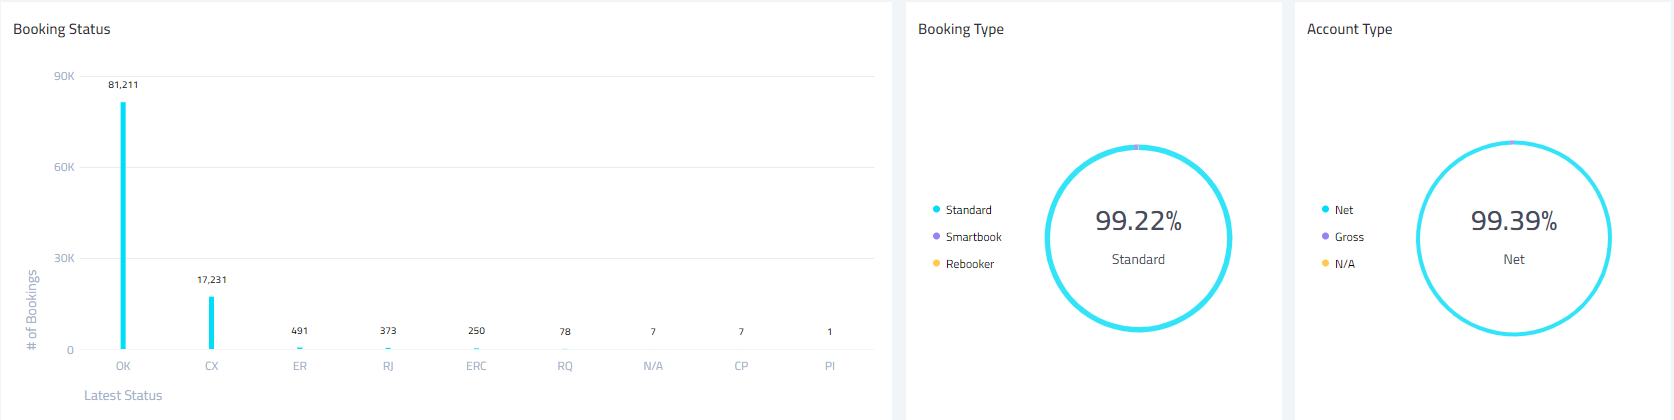
The In Depth widget represents details about bookings, cancellations, distribution of the booking by various categories: pax, number of rooms, refundability and more information such as :
- Source market of your end-costumer by residency & by IP.
- Currencies distribution.
- More
Top 10
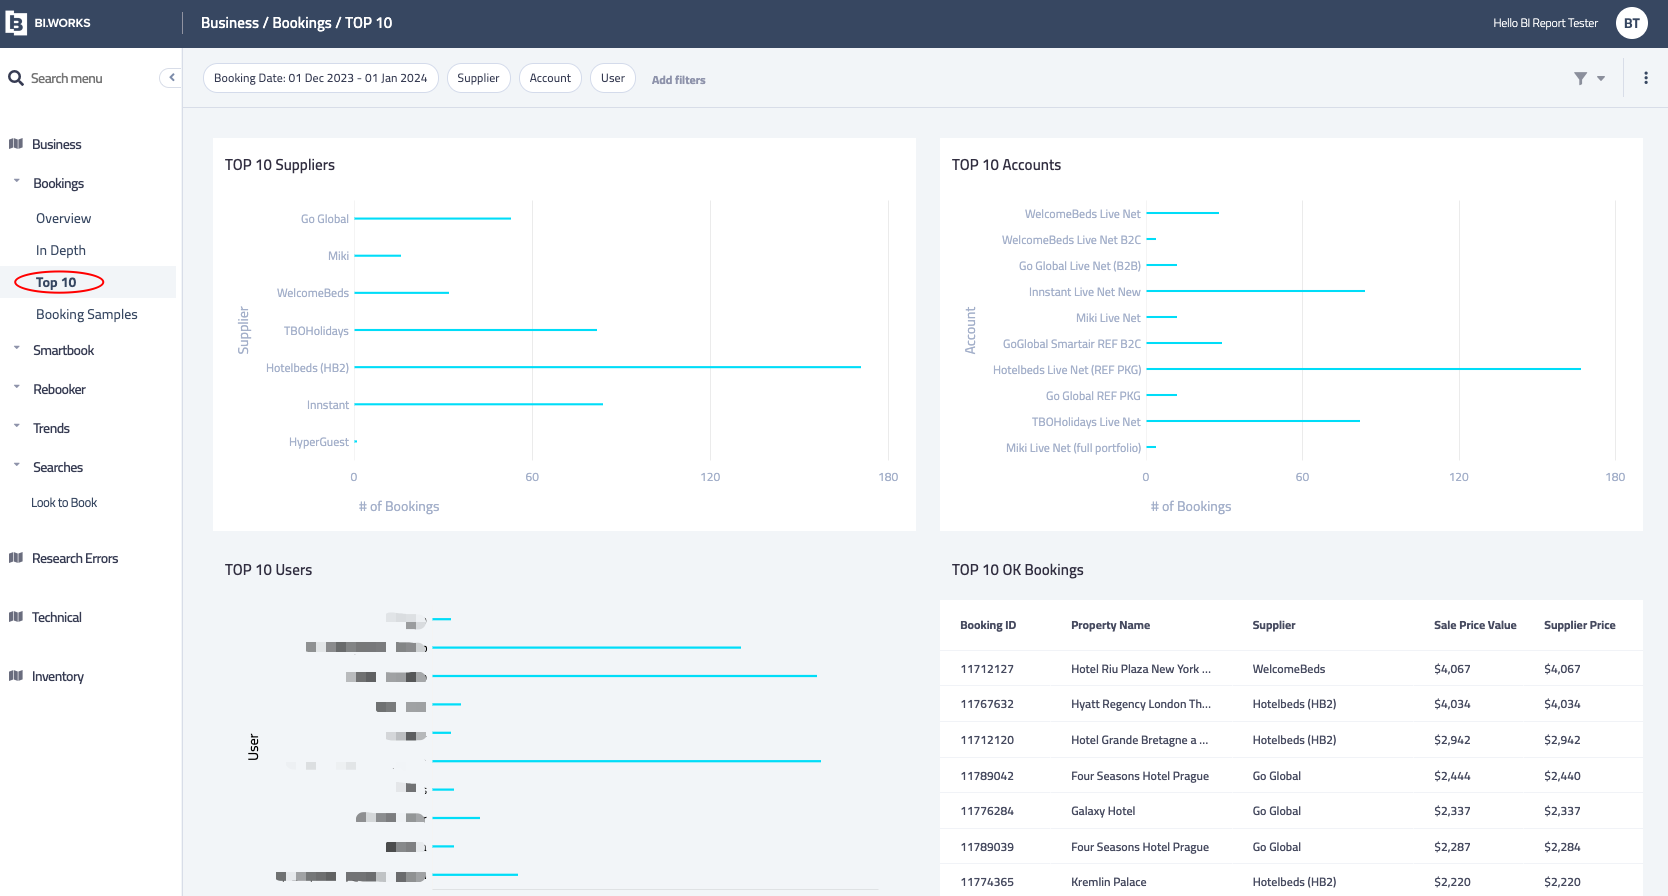
The Top 10 widget represents bookings by Top 10.
- Top 10 booked Suppliers.
- Top 10 booked contracts.
- Top 10 Users.
- Top 10 Hotels booked.
Bookings Samples
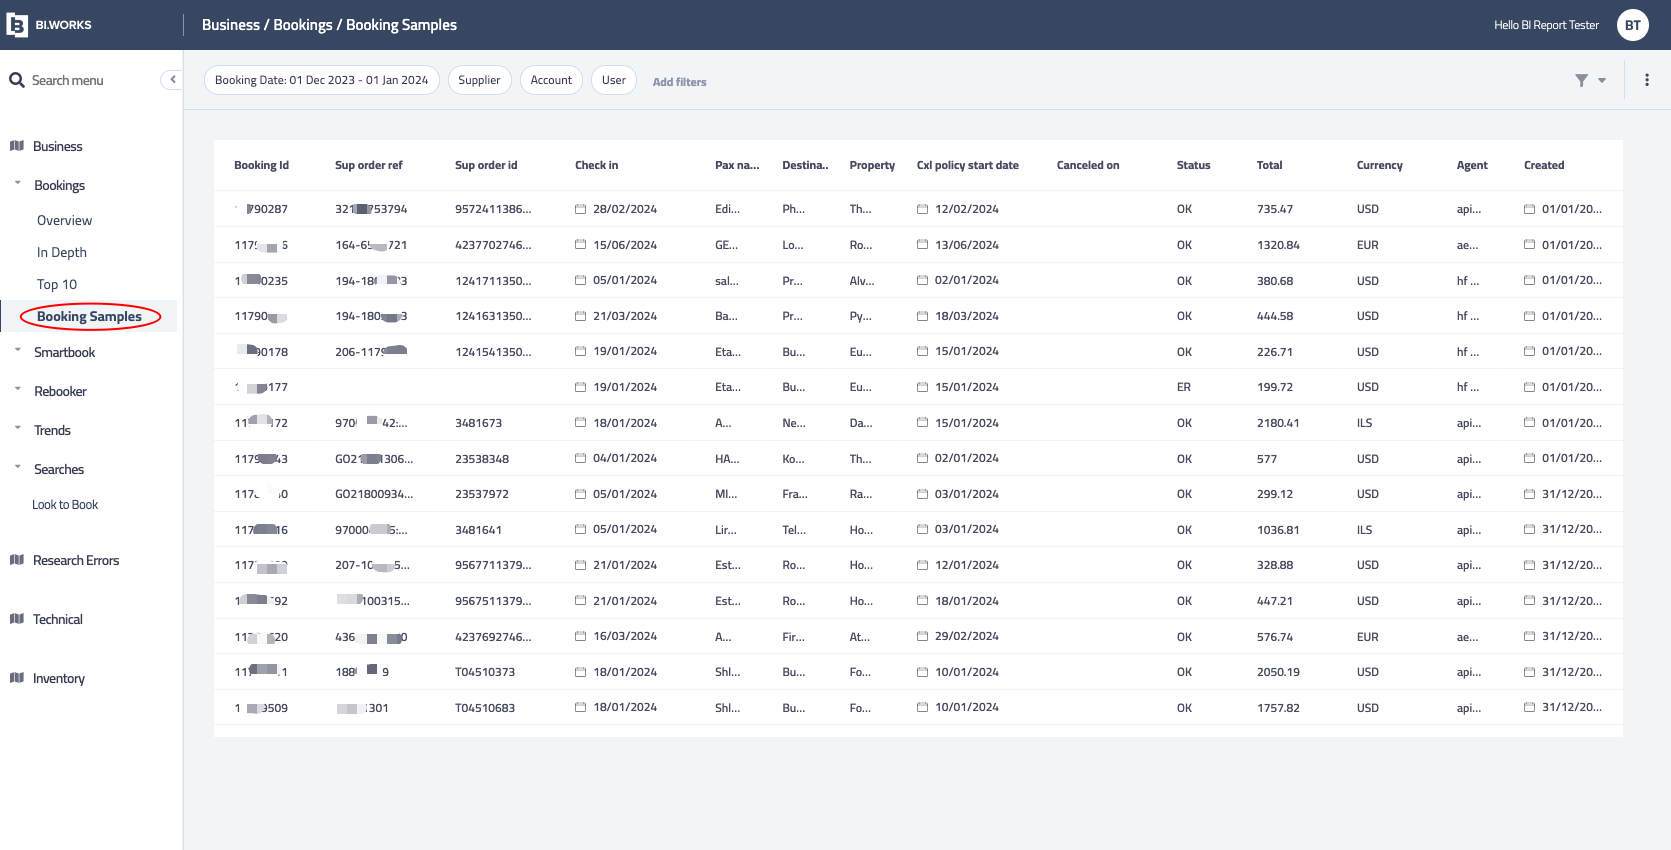
Samples of Bookings (not all reservations) were made according to selected filters , the List can be ordered by clicking the relevant column.
SmartBook
The SmartBook section is specifically designed to offer data, insights, and visualizations centered around the SmartBook feature.
This section aids in delving into financial details such as profit increase and booking salvages by SmartBook over time, by Users and suppliers. It provides a thorough examination of multiple performance metrics, including time distributions, profitability margins, and all essential SmartBook related data.
Overview
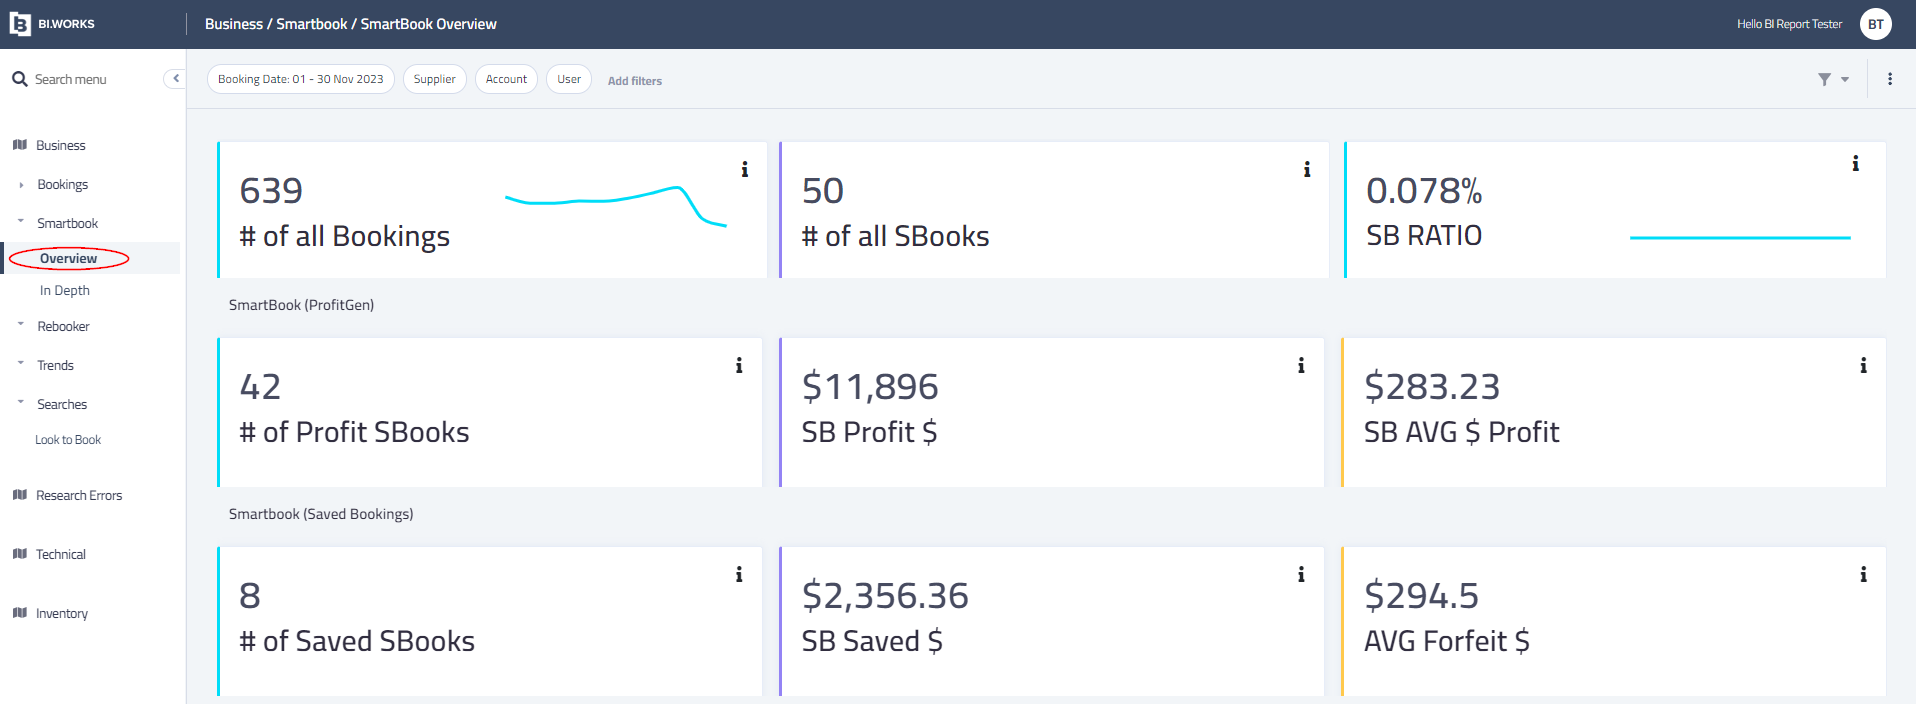
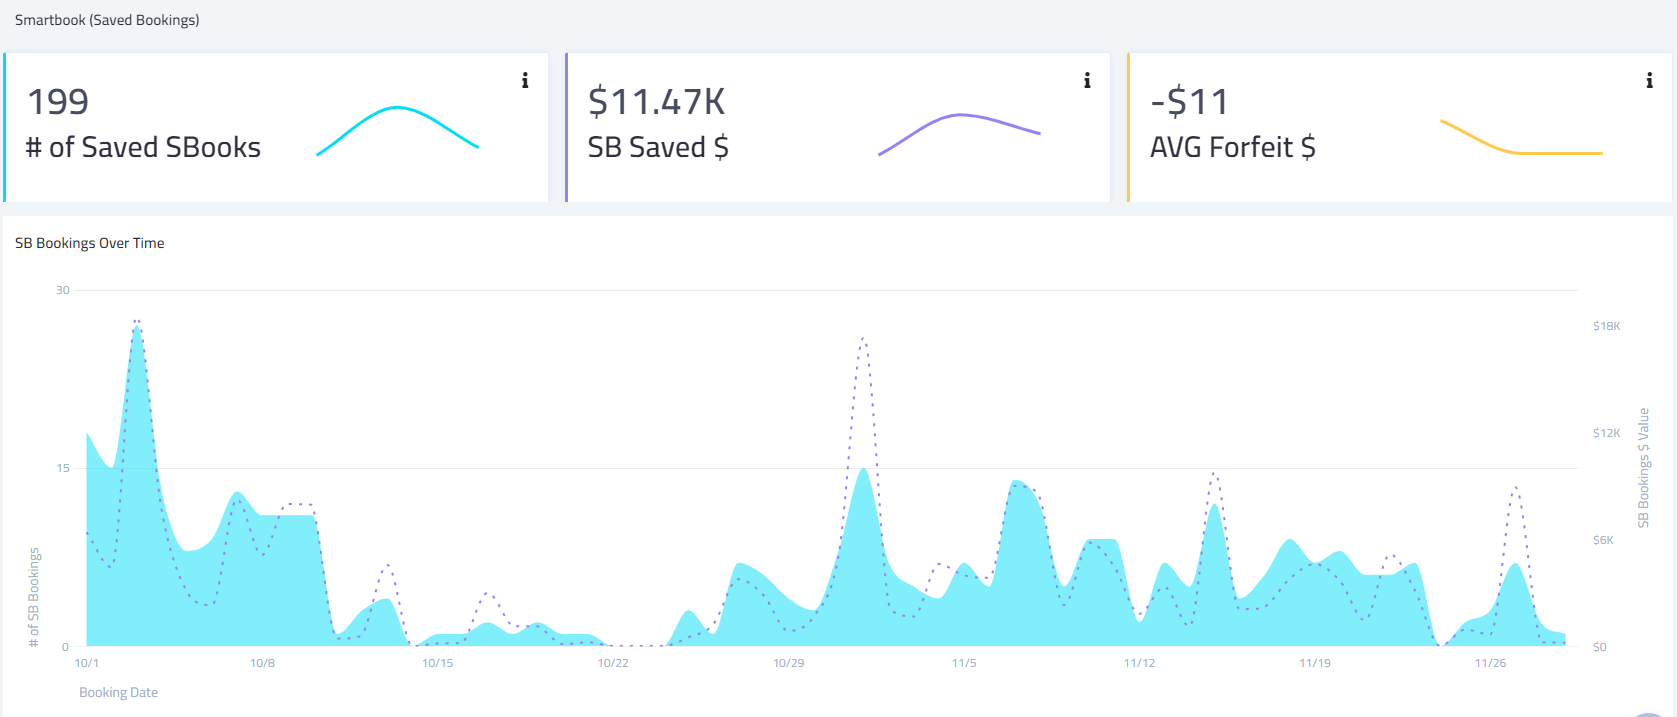
The Overview widget represents SmartBook related data according to selected filters. Along with crucial data such as:
- Ratio of total bookings vs. SmarBook.
- SmartBook profit gen - total bookings, profit, AVG profit.
- SmartBook Saved (Salvaged) bookings - total bookings, profit, AVG profit.
- Graph which represents the SmartBook bookings over time.
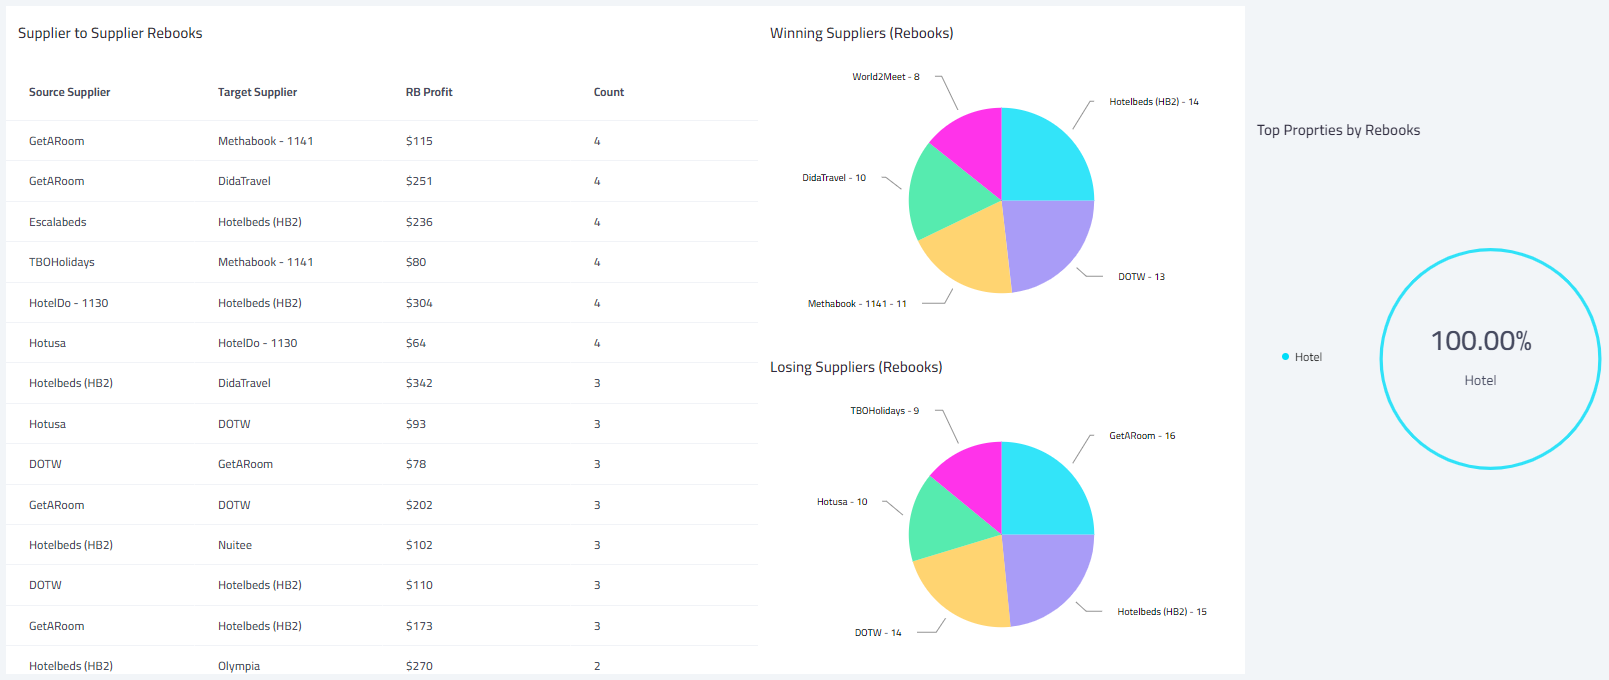
In Depth
More In Depth SmartBook details - bookings and split among the Suppliers and Destinations, in 2 perspective: Profit Increase and Salvage booking. In this section, you'll find In depth data such as:
- SmartBook bookings per suppliers.
- SmartBook profit per supplier.
- Losing suppliers.
- More.
Rebooker
The Rebooker section is specifically designed to offer data, insights, and visualizations centered around the Rebooker feature.
This section aids in delving into financial details and booking which rebooked by Rebooker over time, by Users and suppliers. It provides a thorough examination of multiple performance metrics, including time distributions, profitability margins, and all essential Rebooker related data.
Overview
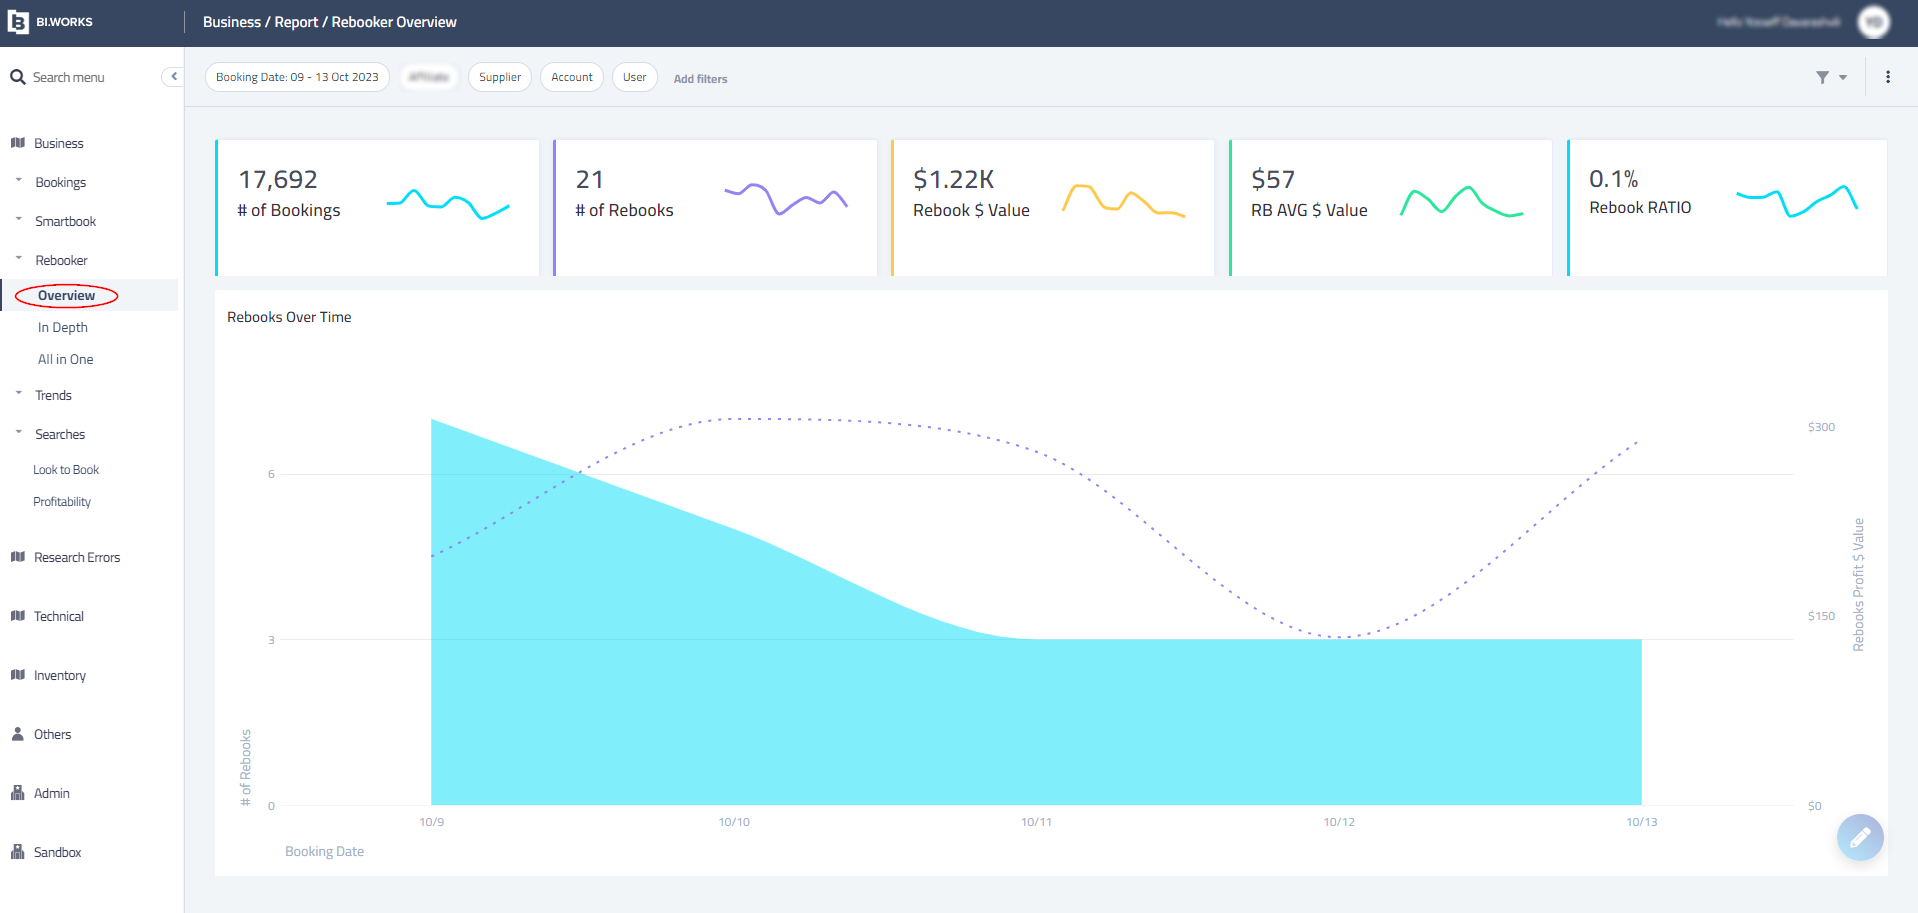
The overview widget represents Rebook statistics over time. With valuable information such as:
- All bookings vs. Rebooker.
- Rebooker profit increase.
- AVG Rebooker profit.
- Rebooks over time graph.
- More.
In Depth
The In Depth represents further and more In Depth Rebooker data, such as:
- Rebooker trends.
- Rebook length till free cxl policy.
- Rebook lead days to check-in.
- Rebooks by supplier / user.
- More
Trends
The Trends section is tailored to provide insights, data, and visualizations focusing on yearly trends.
It delivers essential information on trend patterns and client performance over time, including comparisons of supplier deviations on a daily, weekly, monthly, and yearly basis, among other significant details.
Supplier Deviation
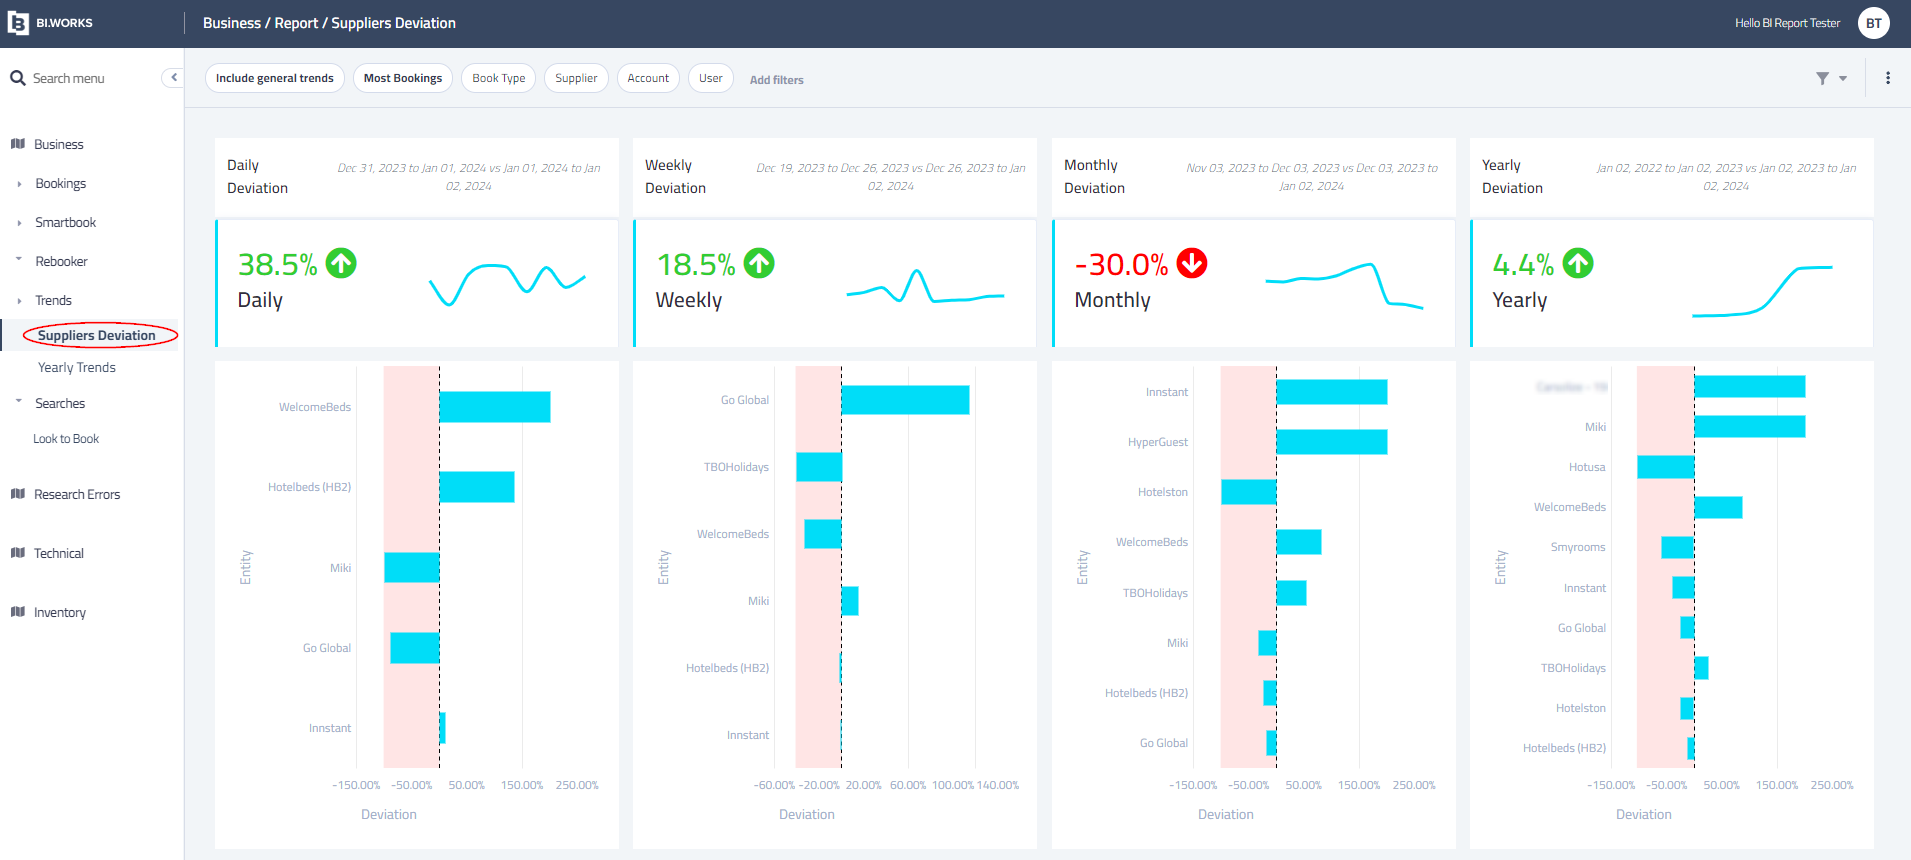
The Suppliers Deviation offers a quick view per Supplier, by compared to past Day, Week, Month, Year. Gives you all the nessacery data which required to understand deviation over time by the different suppliers.
Yearly Trends
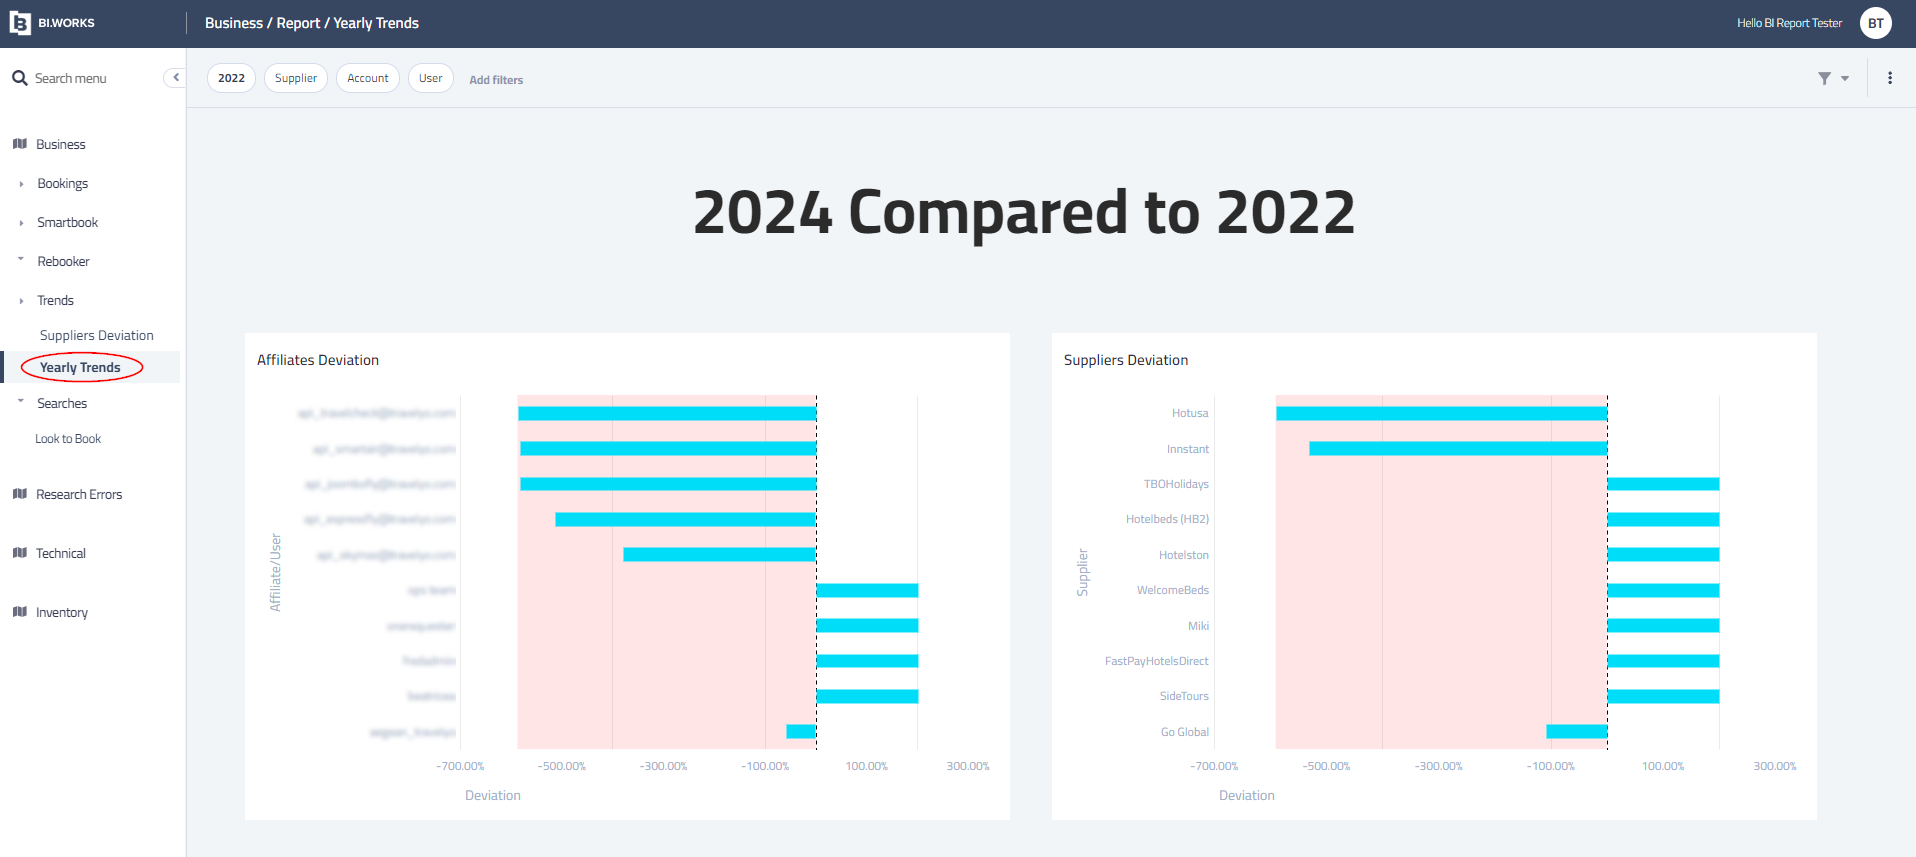
The Yearly Trends offers a comparison of your current year vs previous years - per Users / Suppliers, it allows to find what contributed to your growth or declining, such as:
- Client deviation.
- Supplier deviation.
- Book type, Country, Star Rating, Length of stay.
- More
Searches
The Searches section is tailored to provide insights, data, and visualizations focusing on Hotel Searches.
It delivers essential information on searches patterns over time, including comparisons of successful and failed searches as well as searches distribution over Suppliers and search types.
Clients
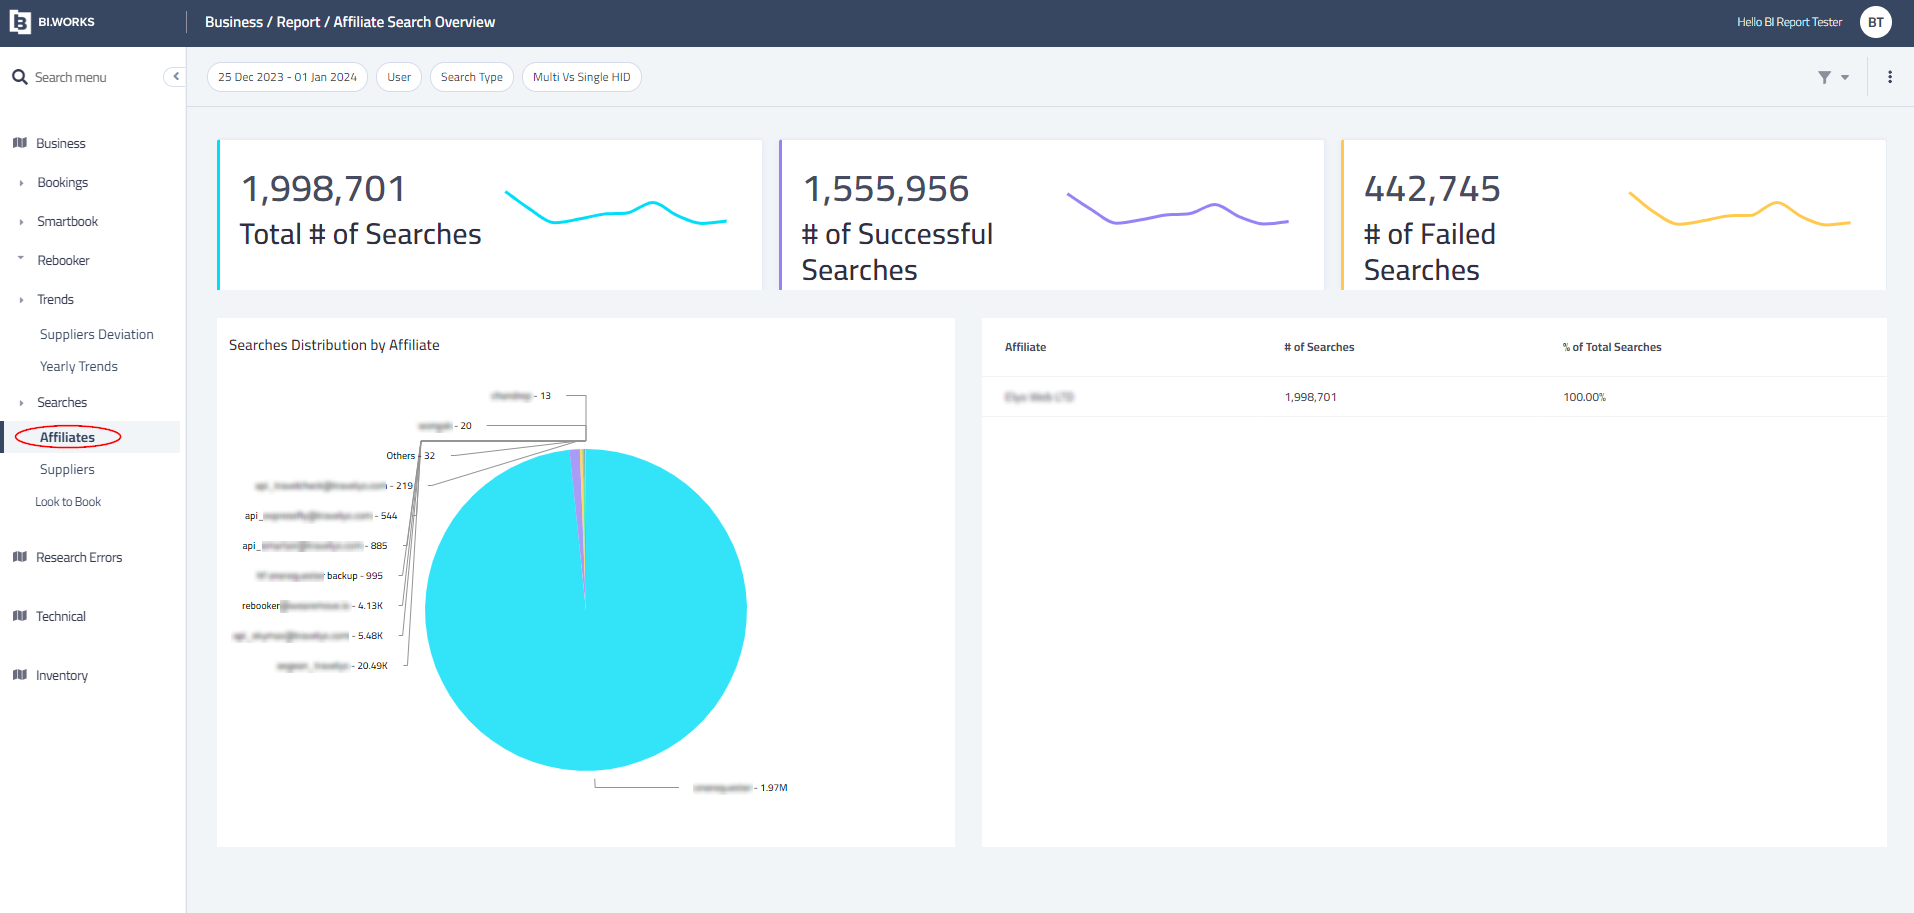
The client widget represents searches data over-time, among with data related to searches such as:
- Searches distribution by users .
- Successful vs. Failed searches.
- Top countries.
- Search types (Geo vs. HotelIDS)
- Single vs. Multiple HotelIDs.
- More.
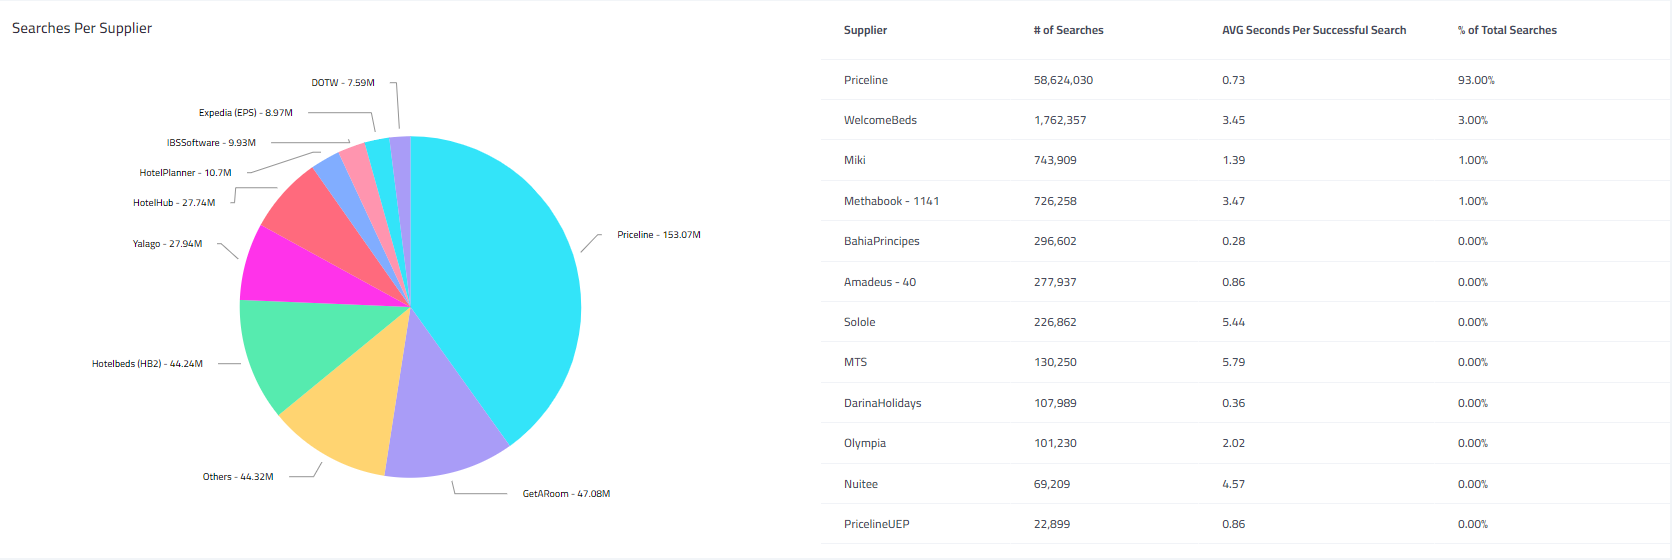
Suppliers
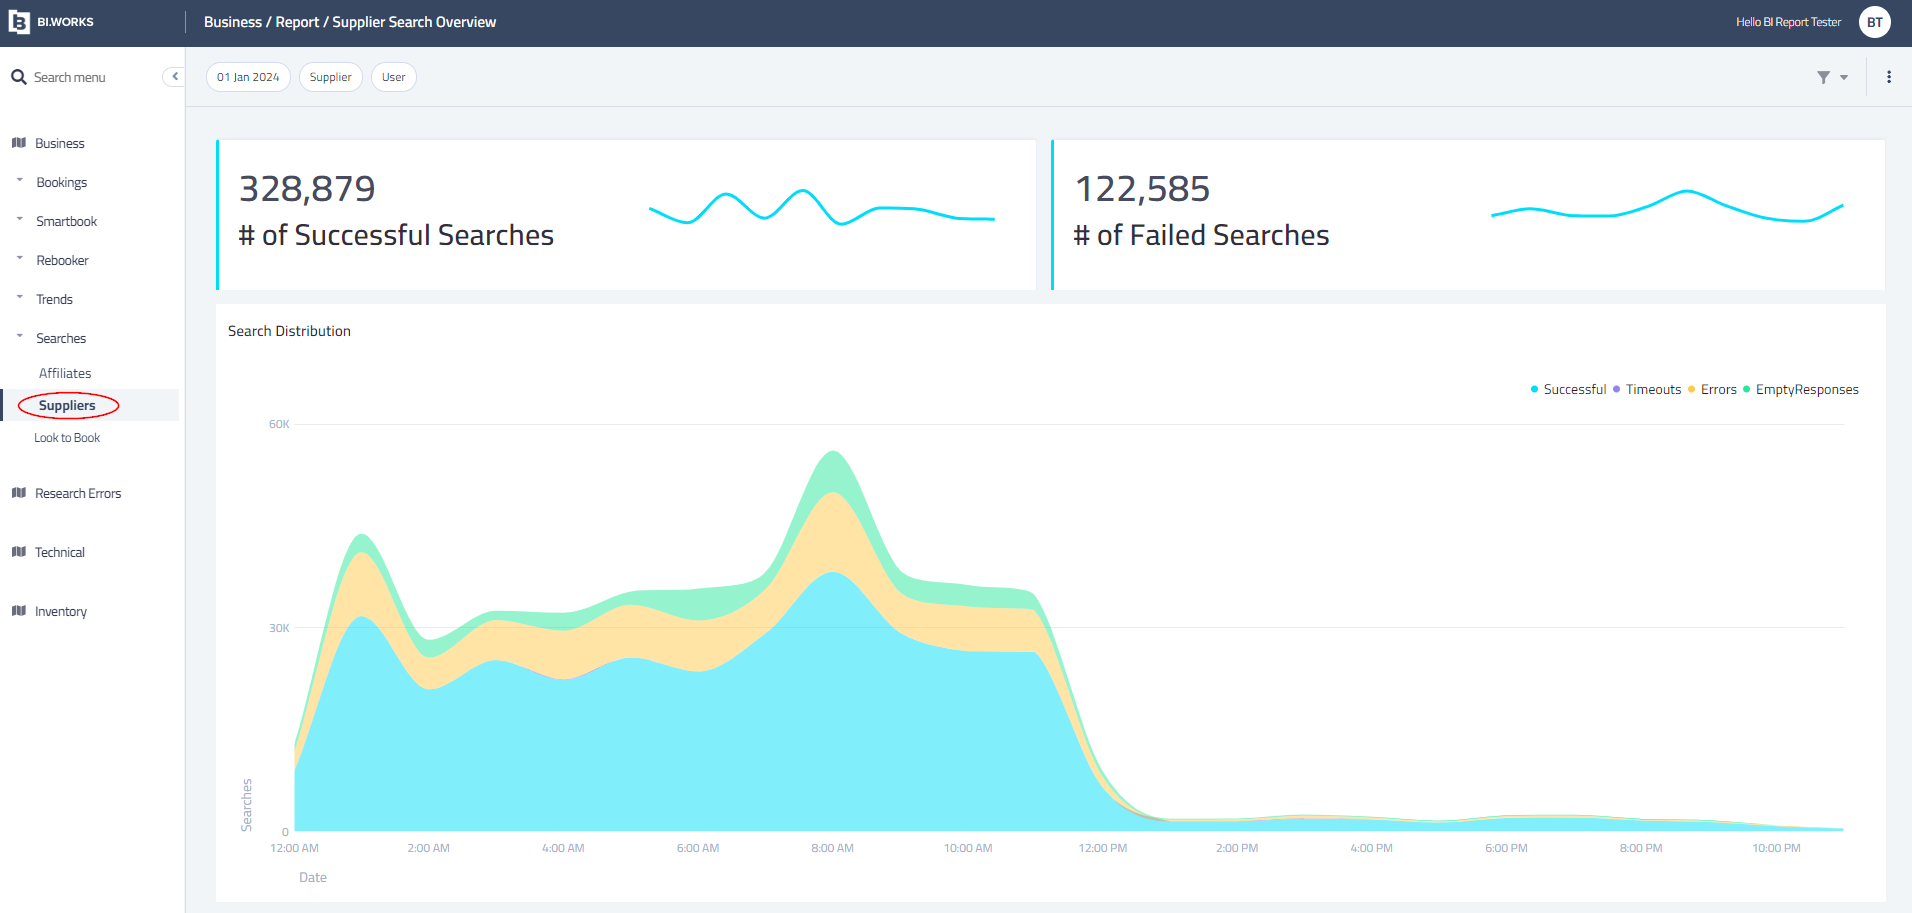
The Suppliers widget represents searches trends and ratio between Successful searches, timeouts, errors and empty response and split among Suppliers and the average response time. offers crucial insights such as:
- Which supplier has the most high response times.
- Which searches are likely to be failed.
- More.
Look to Book
The Look to Book area is specifically designed to offer insights, data, and visualizations concerning the comparison between your bookings and initial searches, essentially focusing on the Look to Book ratio.
This section provides key data on search patterns over time, including the comparison of successful bookings against total searches made. It also details the ratio of searches to bookings for each supplier.
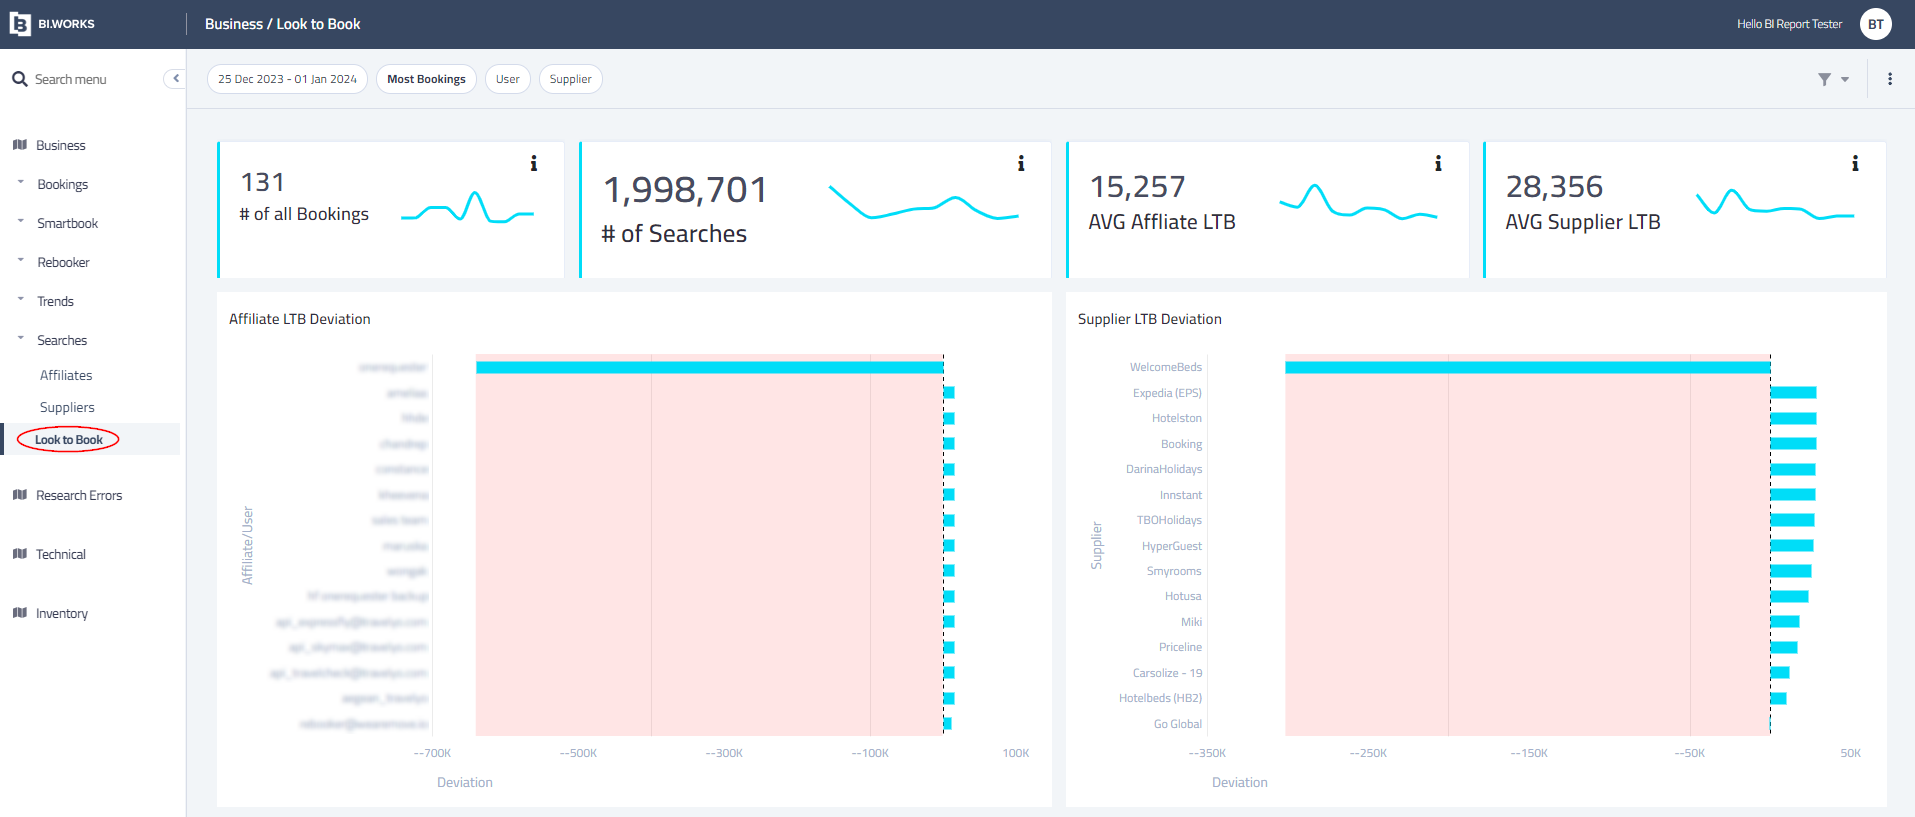
The Look to Book widget represents your Look 2 Book ratio per different suppliers, users, accounts (contracts) and more.
Important
There are Suppliers that support searches by Destination code or Geo locations, so a single search request been sent to the Supplier, there are Suppliers that supports list of IDs and limits the amount of IDs that is allowed to send per request, so it may reflect a different L2B ratio.
Highly Recommended
Analyze each Supplier individually in order to find the accurate L2B ratio.
2. Research Errors Section
The Research Errors section is dedicated to providing data & insights about which requests / Suppliers are not returning results and the reason.
It facilitates the exploration of errors across suppliers. This section allows for a comprehensive review of various performance indicators including errors, error samples and crucial information regarding the performance of your connected suppliers.
Supplier
Search Errors
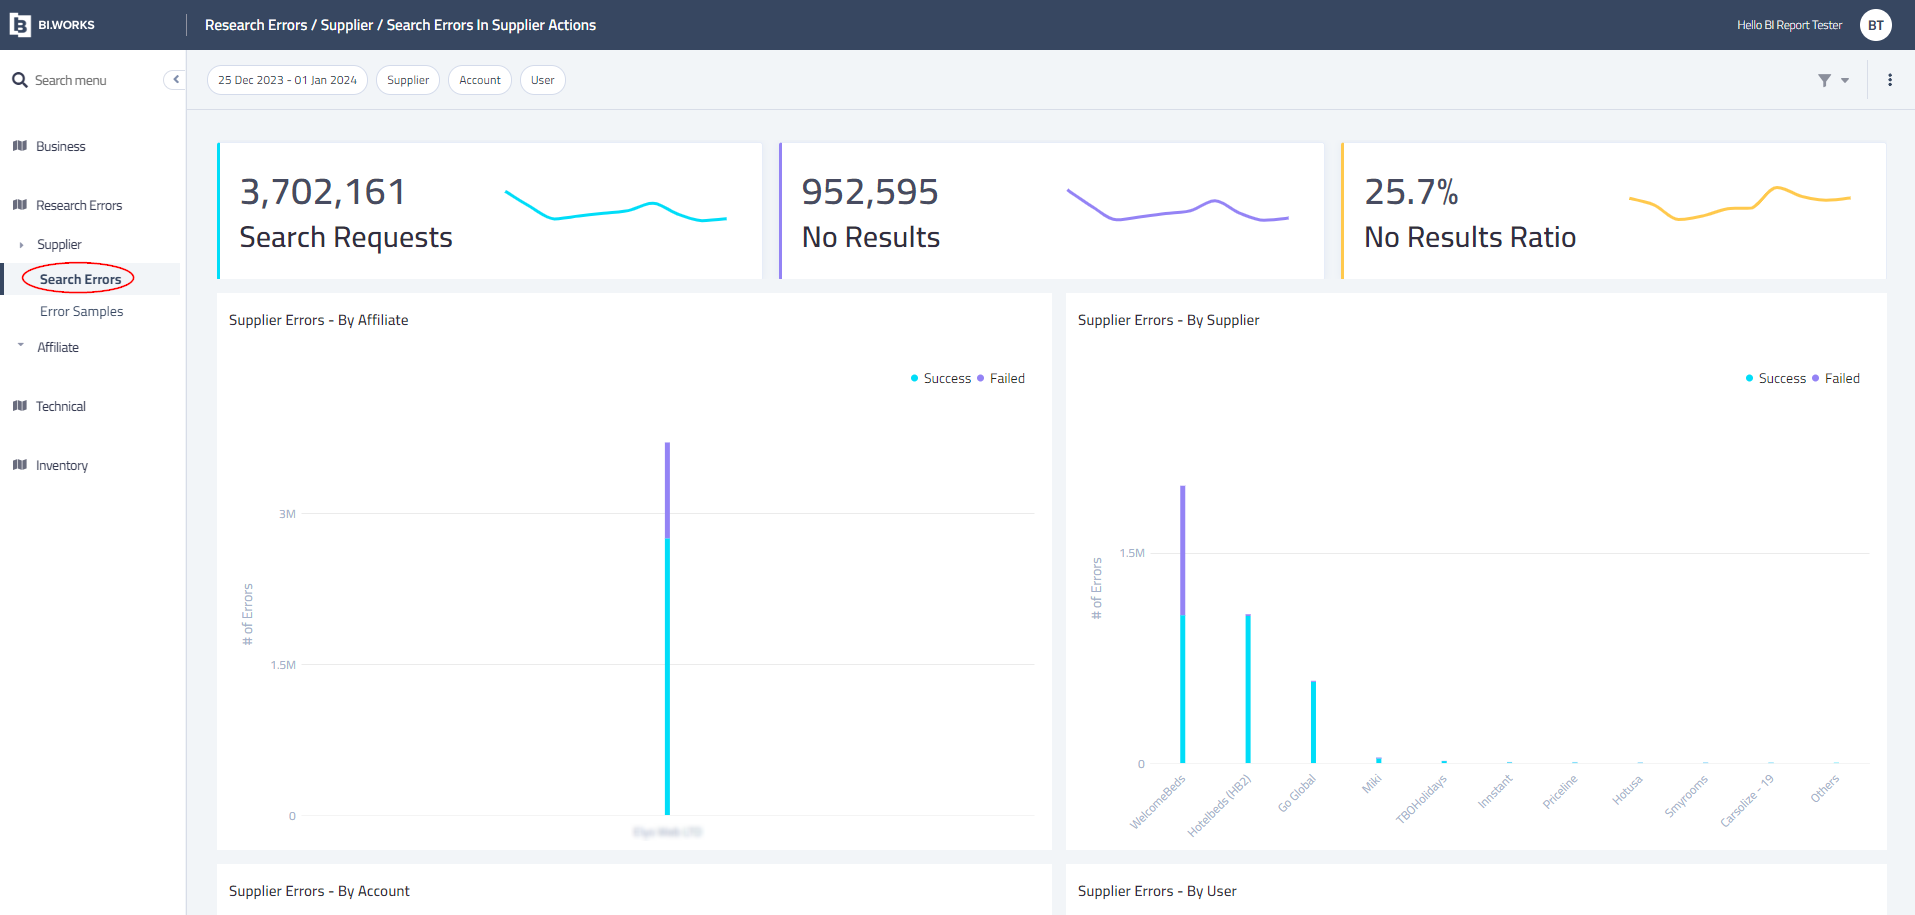
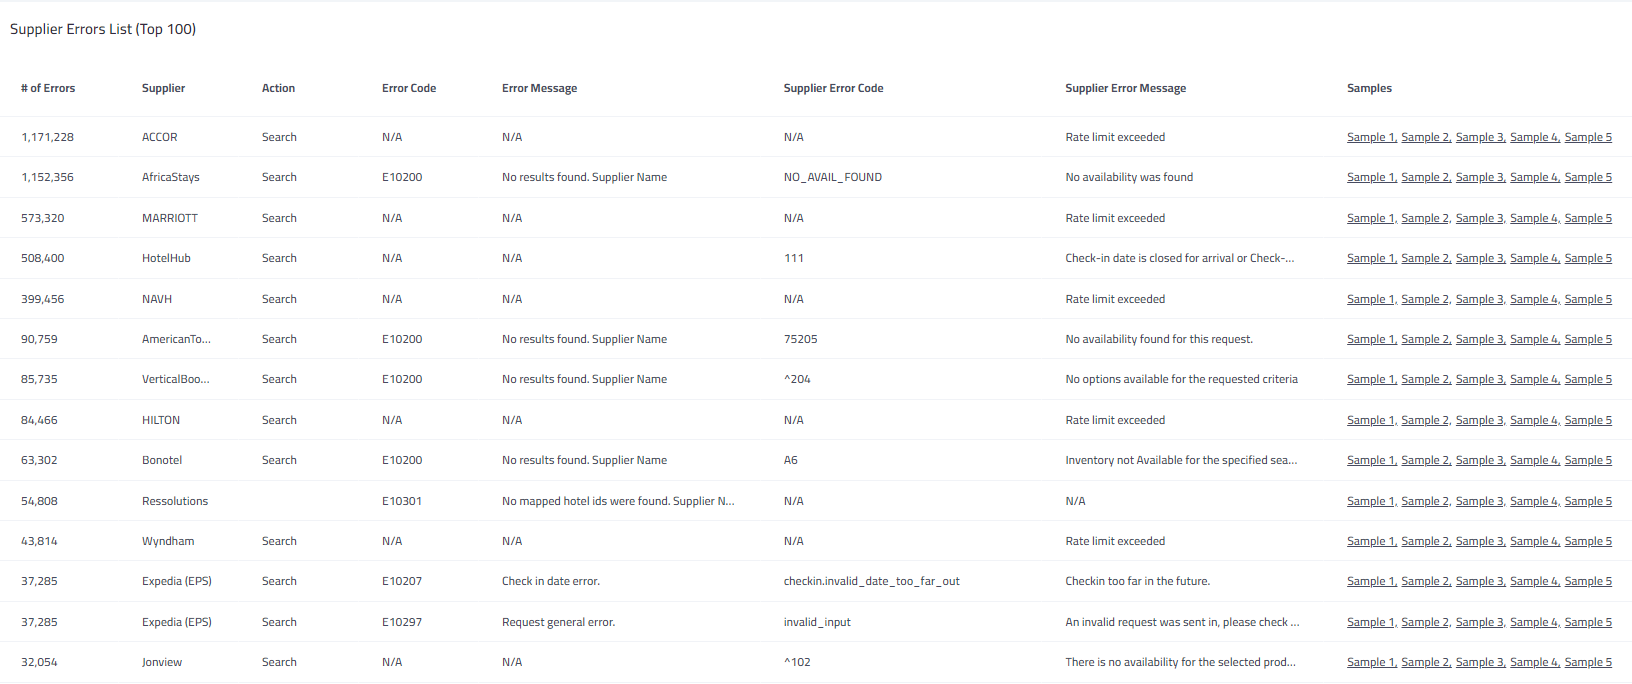
The Search Errors widget displays the errors returned by connected suppliers and provides data about the errors occurring during search requests, broken down by each connected supplier.
This widget simplifies the process of investigating error messages returned in search responses, determining whether errors originated from the supplier or the v system. To minimize these errors, follow the guidelines provided in the Highly Recommended section.
Search Errors
Visibility on errors that were returned in the Search by the Supplier.
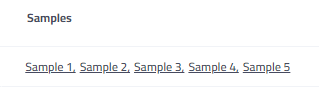
Error Samples
Links to the Logs for the relevant Errors that been selected by the Filters, Click on the “Sample” link (required to have access and privilege to Logs system).
Highly recommended:By clicking on each ‘Sample...’ it will redirect to the Session (Logs viewer) - find which Supplier returned an error.
Download the request and response from the relevant Supplier and send to the Supplier to check and to advise what can be done in order to avoid from Errors.
Client Report
Search Errors
Visibility on errors that were returned in the Search
Error Samples
Links to the Logs for the relevant Errors that been selected by the Filters,
Click on the “Sample” link (required to have access and privilege to Logs system)
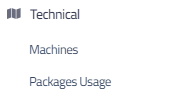
3. Technical Section
Dedicated Cluster is the client's private cluster of machines that supports the traffic from all API Users and Agents from all channels.
NOTE :If your user are operating under "Shared" cluster - this section is irrelevant .
Machines Report
Expose the amount of machines that supports the demand of Searches and bookings, the client can identify spikes and abnormal behavior that impacts the amount of active machines in the cluster.
4. Inventory Section
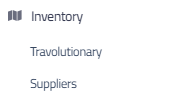
Suppliers Report
The report exposes the amount of properties that have been mapped in HSP by amount of Properties, new Properties that were added and updated per Supplier.
It allows to see how many properties a Supplier feeds and loads into a HSP system.
Important
Suppliers are responsible for the amount of properties they load in HSP system.
Login Details
Link to BI.Works and credentials will be provided per request by HSP Support team.
Examples
Business section - In depth
Searches - Suppliers
Research - Error samples
SmartBook - overview
Updated about 2 months ago