
Monitoring and perfomance
Each Ratefox API Client will be equipped with a dedicated Grafana user, enabling the monitoring and analysis of your request performance and profit increase data.
Main Dashboard
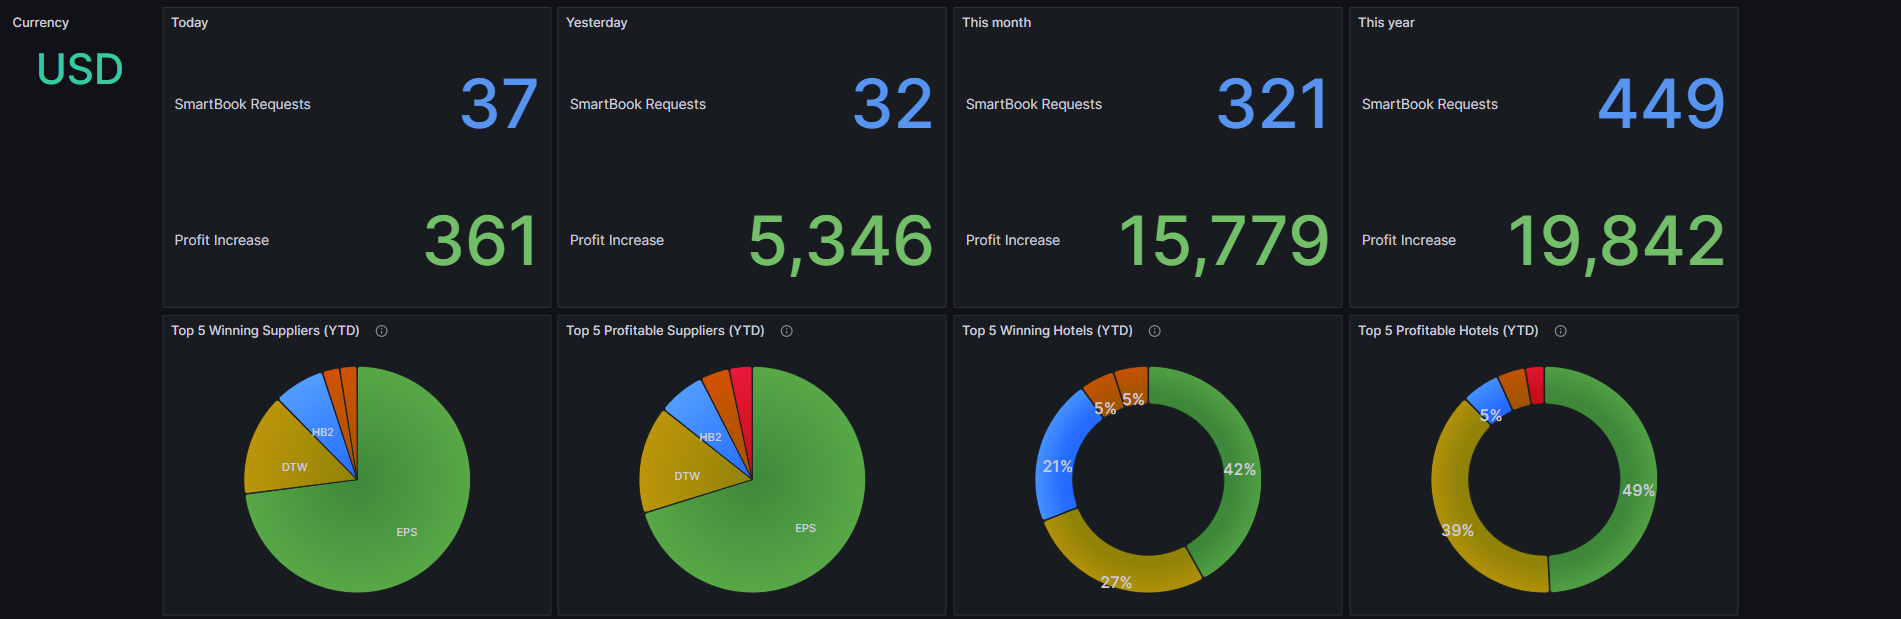
The main dashboard will display key metrics such as the number of requests and the profit increase for various time frames: Today, Yesterday, This Month, and This Year. This provides a comprehensive overview of the partner's performance and other crucial data.
Additionally, the dashboard offers insights and statistics including your top 5 most winning and profitable suppliers, as well as the top 5 winning and profitable hotels.
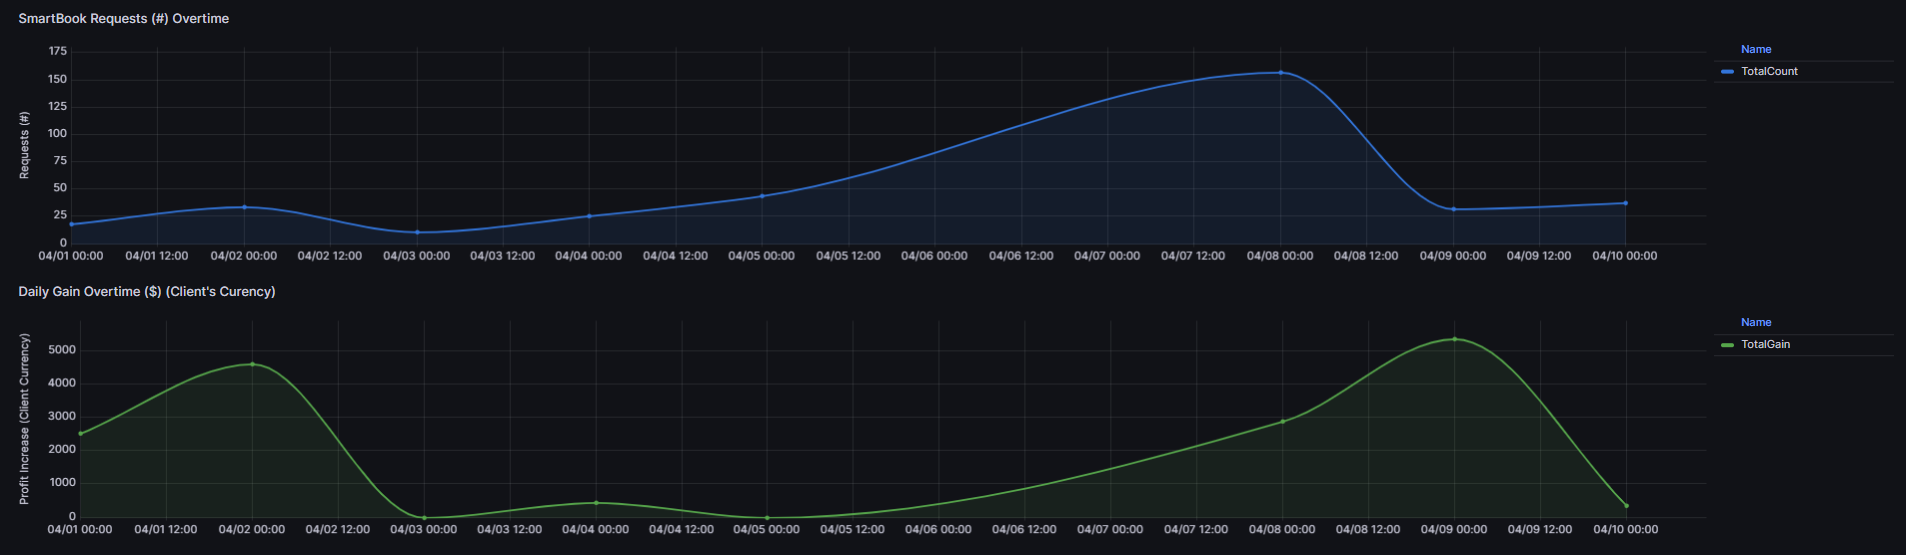
In addition to performance statistics, there are two graphs available that enable partners to track and analyze information over time such as the number of requests per day and the daily profit increase.
Updated about 2 months ago